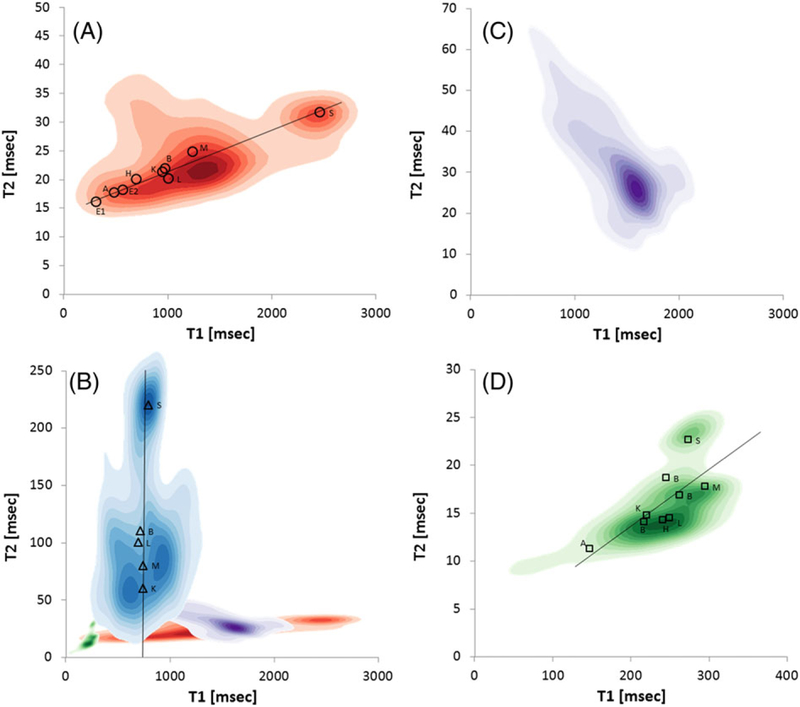
FIGURE 2.
The kernel density plots, T2 = f (T1) generated from respective T1 and T2 parametric images shown in Figure 1. A, FF specimen. A straight line (linear fit of experimental point) is drawn to guide the eye. B, FFPE specimen. For the relative scale and position of the ranges, also shown are kernel plots from panels A, C and D on the same scale. C, Fresh specimen at 4°C; it is hard to identify organs because most relaxation time values are centered on T1/T2 1600/30. D, FF specimen in 1mM GdDTPA. A‐C have the same T1 range but the T2 ranges were customized for each panel. Symbols in A (circles), B (triangles) and D (squares) show average values for respective ROIs: atrium (A); brain (B); egg (E); heart (H); kidney head (K); liver (L); muscle (M); swim bladder (S). The water values for FF and Gd are reported at 21°C, fresh at 4°C and FFPE at 58°‐60°C. The ROIs for selected organs were obtained by organ outlining using the ParaVision ROI tool

