
Fig. 3.
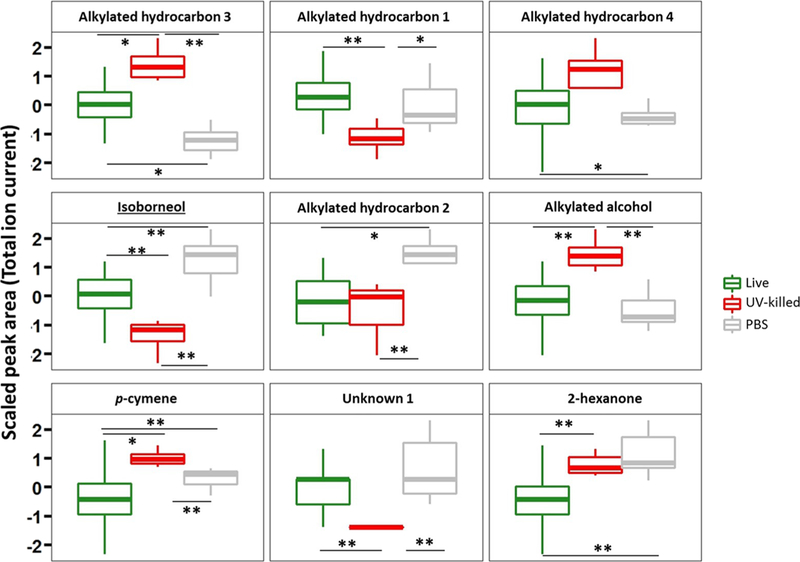
Boxplot of nine volatile metabolites used to discriminate Live-group versus PBS versus UV-killed. * p < 0.05; ** p < 0.01. The lower, middle and upper lines of the box correspond to the first, second and third quartiles (the 25th, 50th, and 75th percentiles, respectively). The upper whisker extends from the upper line to the largest value no further than 1.5 × IQR from the line (where IQR is the inter-quartile range). The lower whisker extends from the bottom line to the smallest value at most 1.5 × IQR of the range. Data beyond the end of the whiskers are called “outlying” points and are plotted individually