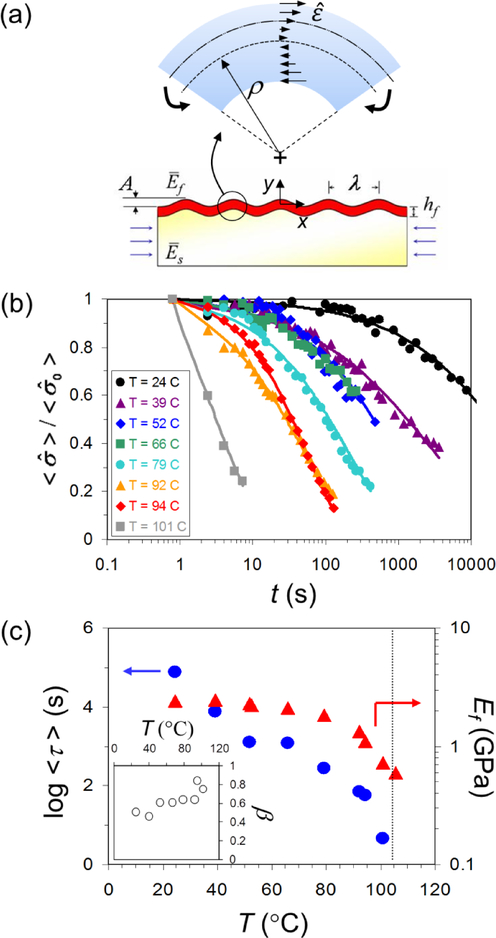
FIG. 3.
(a) Schematic of the local shear stress fields induced by local bending along a wavy surface. (b) Normalized average stress () applied to PS films (hf = 31 nm) as a function of t, showing the relaxation of the wrinkle pattern at various T below Tg. The solid lines are stretched exponential fits. (c) Average relaxation time (τ: circles) and high frequency Young’s modulus (Ef: triangles) for PS films (hf = 31 nm) as a function of T. The vertical dotted line indicates the bulk Tg of PS, and the inset shows the plot of stretched exponential coefficient (β) vs. T.

