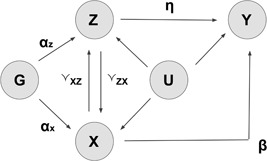
Figure 2.

A general diagram representing potential pleiotropic influences in Mendelian randomization studies. αx, αz: genetic association parameters between X~G and Z~G; β: causal effect of interest (X on Y); γxz and γzx: possible direct causal effects of X on Z and Z on X, respectively; η: the pleiotropic pathways of Z on Y; G: genotypes; X: phenotype of exposure; Y: response of interest; Z: potential pleiotropic phenotypes
