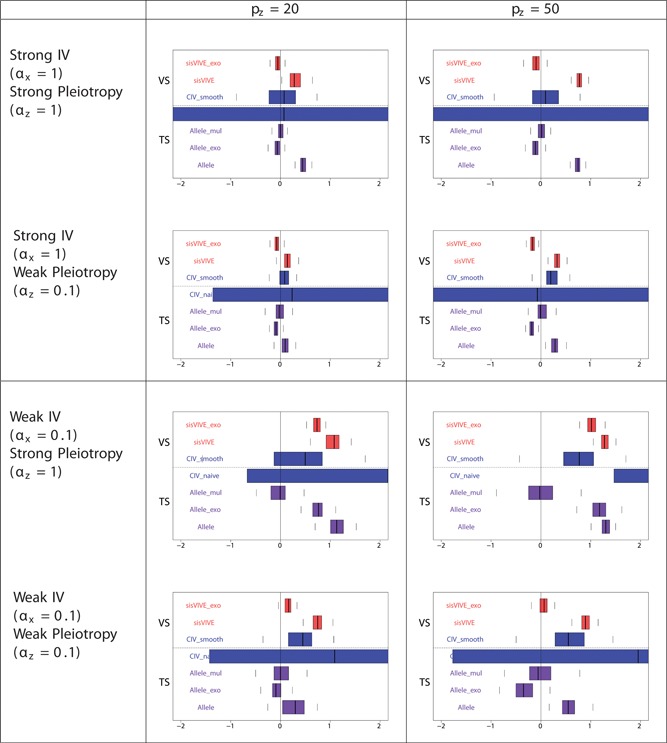
Figure 13.

Boxplots of the bias of the causal effect estimates, β‐1, from external validation sample and two‐sample set‐ups in simulation Series II. The panels display results for different values of αx and αz corresponding to different instrument strength and pleiotropy severity. pz denotes the number of pleiotropic components among all 100 single nucleotide polymorphisms in G. The dashed line separates external VS results from TS results. TS: two‐sample; VS: validation sample
