Fig. 2.

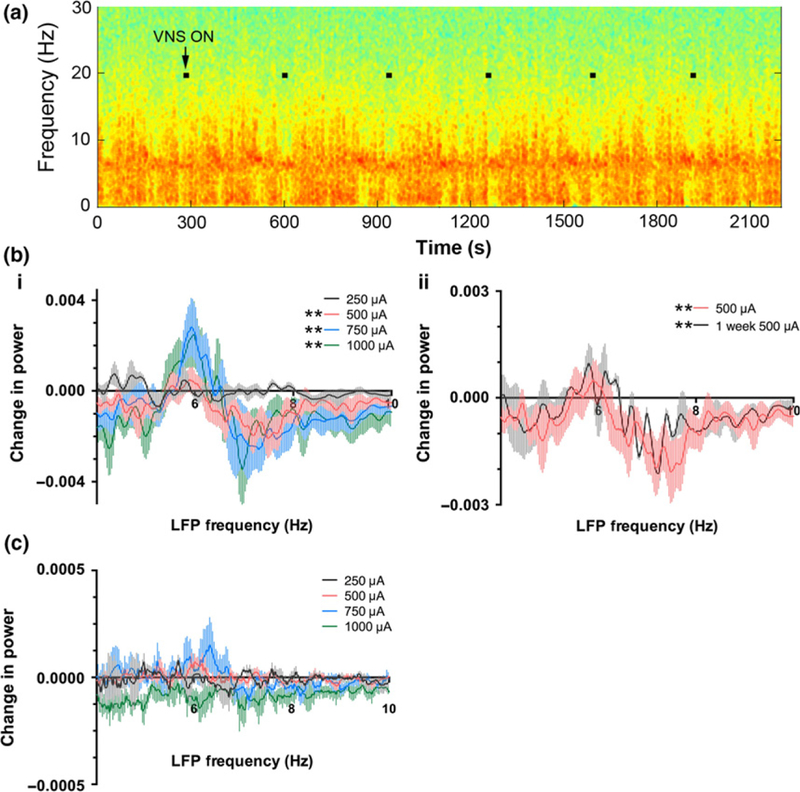
Vagal nerve stimulation (VNS) affects hippocampal field potential properties by increasing power in the low theta frequency range (5.5–6.5 Hz) and simultaneously decreasing power in the higher theta frequency range (6.5–8.5 Hz). This effect was dependent on the VNS intensity and persisted after 1 week of VNS treatment. (a) Example spectrogram of a local field potential recording from CA3 of hippocampus during VNS OFF and ON periods. Warmer colors represent greater spectral power, and cooler colors represent less spectral power. Black squares on the spectrogram show periods of VNS ON. (b) Quantification of the effect of VNS on theta (4–10 Hz) spectral power for the population of recordings and animals. Spectral power in the theta band was measured for 30 s before the onset of VNS and during the 30 s of VNS ON. The difference in power at each frequency point was plotted for each VNS intensity (i) and for 500 μA stimulation after 1 week on VNS (500 μA) treatment (ii), which is plotted with the identical 500 μA data as shown in i for comparison. All VNS intensities except 250 μA produced a significant shift in hippocampal theta power. (c) VNS did not affect amygdala theta power. Identical analysis as described for (b) was applied to local field potential (LFP) measured from amygdala. *p < 0.05, Wilcoxon matched-pairs signed rank test.
