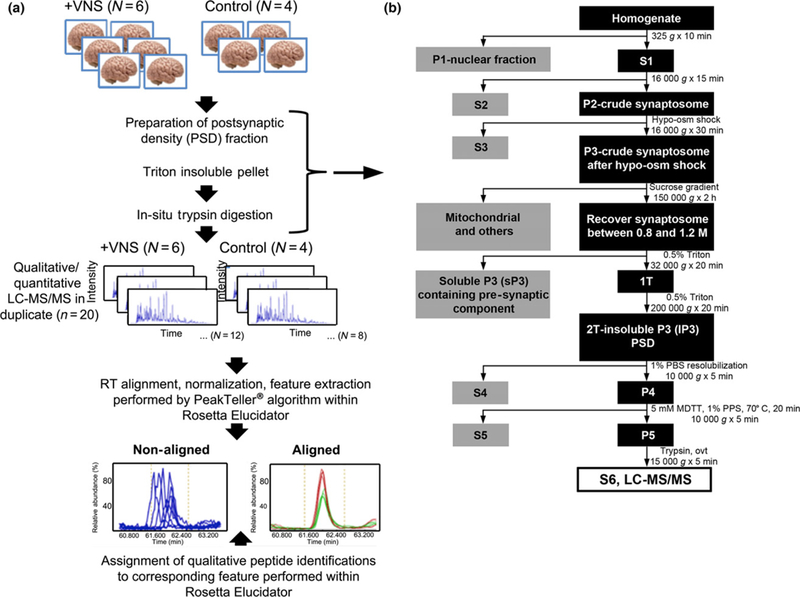
Fig. 3.

Protein measurements were made from animals that received 1 week of vagal nerve stimulation (VNS) treatment (500 μA). Work flow of sample preparation and data analysis. (a) Sample preparation and data acquisition strategy followed by data analysis workflow utilized in label-free quantitative proteomic analysis of rat postsynaptic density (PSD) fractions as a function of VNS. (b) Detailed description of brain preparation sample treatment from the time of isolation of brain homogenate from each animal through isolation of the S6 fraction, on which liquid chromatography-tandem mass spectrometry (LC-MS/MS) was performed.
