
Figure 1.
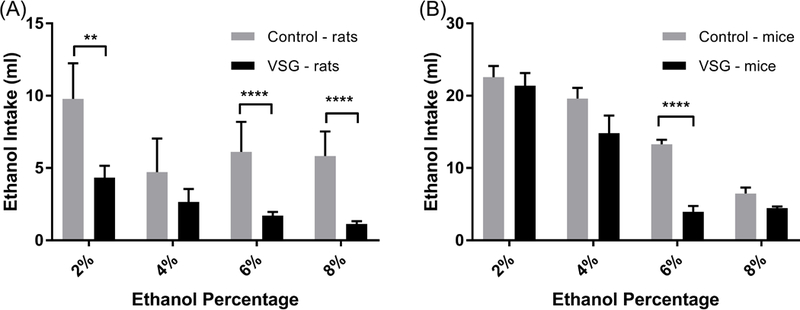
Mean ethanol intake for increasing concentrations of ethanol by VSG and Control groups. (A) Rats: 2-Way ANOVA showed significant difference between VSG and control groups for 2% (**P ≤ 0.01), 6%, and 8% (****P ≤ 0.0001) ethanol concentrations. (B) Mice: 2-Way ANOVA shows significant difference between VSG and Control groups for the 6% (****P ≤ 0.0001) ethanol concentration.