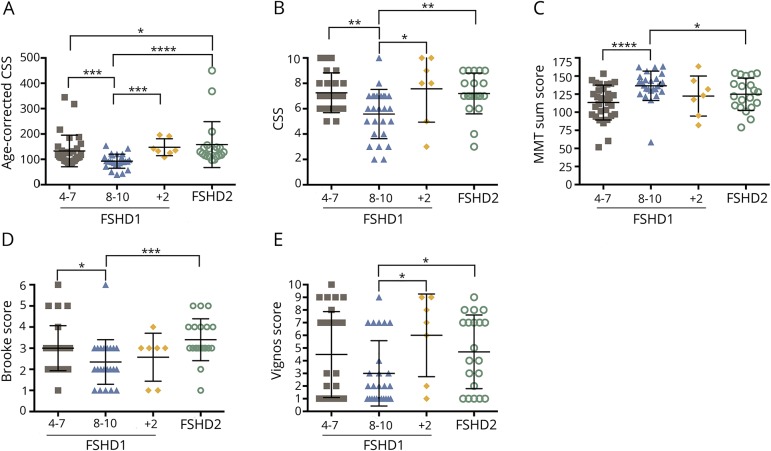
Figure 2. Clinical assessments of the facioscapulohumeral dystrophy (FSHD) subpopulations.
(A) Significant differences in the age-corrected clinical severity score (CSS) between FSHD type 1 (FSHD1) (8–10) and FSHD1 (4–7) (p = 0.0009***), FSHD1+ FSHD type 2 (FSHD2) (p = 0.0002***), or FSHD2 (p < 0.0001****) subgroups are observed. A significant difference between FSHD1 (4–7) and FSHD2 is also present (p = 0.048*). (B) The CSS of the FSHD1 (8–10) subpopulation is significantly different from those of FSHD1+2 (p = 0.036*), FSHD2 (p = 0.002**), and FSHD1 (4–7) (p = 0.003**) subgroups. (C) Significant differences in the manual muscle testing (MMT) score between FSHD1 (8–10) and FSHD1 (4–7) (p < 0.0001****) or FSHD2 (p = 0.047*) subgroups are observed. (D) The Brooke score of the FSHD1 (8–10) subpopulation is significantly different from those of FSHD2 (p = 0.0002***) and FSHD1 (4–7) (p = 0.012*) subgroups. (E) Significant differences observed between Vignos scores of FSHD1 (8–10) and FSHD 1+2 (p = 0.034) or FSHD2 (p = 0.044*) subgroups.

