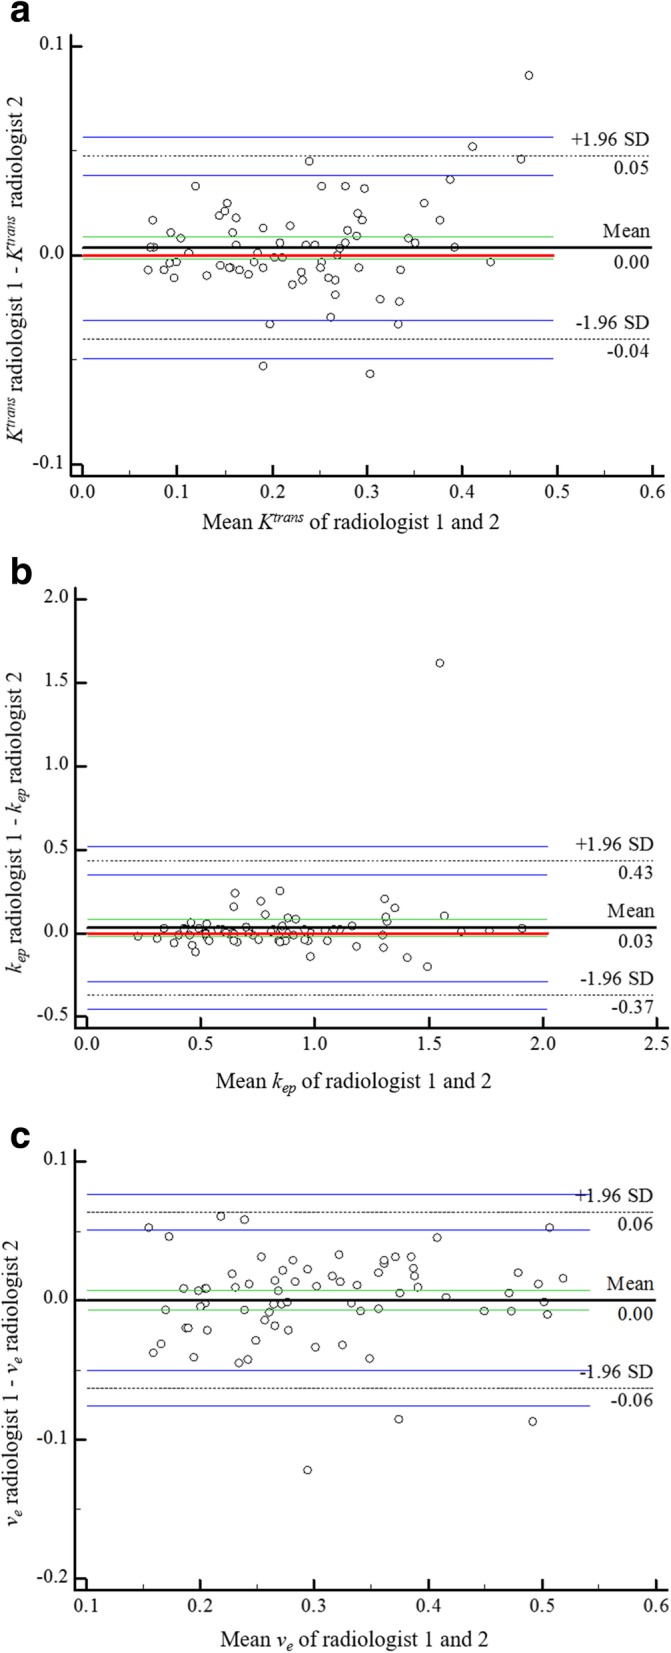
Fig. 5.

Bland-Altman plots for interobserver reproducibility for whole tumour volume DCE-MRI quantitative perfusion parameters measurements. Bland-Altman plots of the mean Ktrans (a), kep (b) and ve (c) values of the two radiologists (x-axis) against the difference between the two radiologists (y-axis). The red continuous line represents the equality (difference = 0); the black continuous line represents the average difference (bias) between the two radiologists; the green continuous lines represent the 95% CI of the average difference; the black dashed lines represent the limits of agreement; the blue continuous lines represent the 95% CI of limits of agreement
