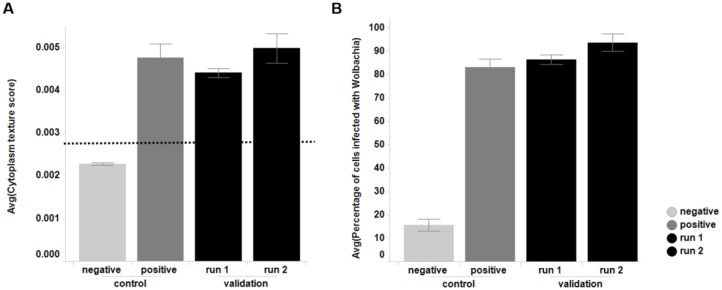
Figure 1.
Control samples (with positive and negative Wolbachia infection) and QC results for the cells used in the validation of this assay, sourced from the single large-scale cryopreserved cell batch used for the full screen. (A) Cytoplasm texture score. The dotted line represents the threshold of the texture score above which cells are classed as infected (0.0028). (B) The percentage of cells that are classed as infected based on their cytoplasm texture score being above 0.0028. Comparison of the negative control with all Wolbachia-infected samples (positive control, validation runs 1 and 2) gives a Z prime of 0.67 and a signal to background of 5.6.

