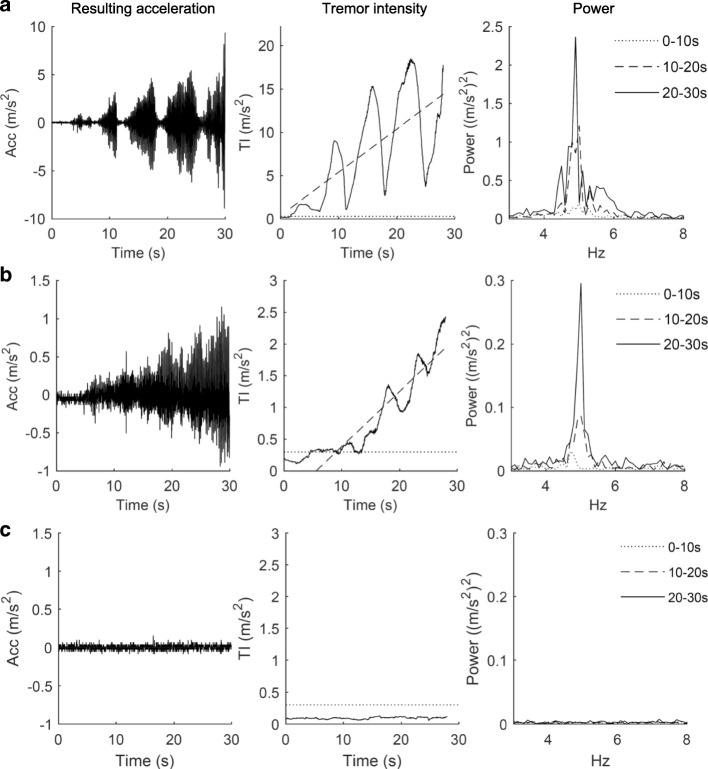
Fig. 1.
Examples of rest tremor. The time course of resulting acceleration (Acc) (left column), tremor intensity (TI) (middle column) and the power spectrum for each 10s interval (right column) for a participant with Parkinson’s disease having substantial intermittent tremor (row a), a participant with Parkinson’s disease having mild continuous tremor (row b), and a reference participant (row c). The signal-to-noise ratio is low in row c (left column) due to very low intensity or absence of hand movements in the reference participant. Note that axis scales in row a are different from row b and c. In the TI plots, the intensity-limit of rest tremor (mean TI of REF + 2 SD) is indicated by a dotted line and the least-square best-fit linear regression of TI(t) is indicated by a truncated line

