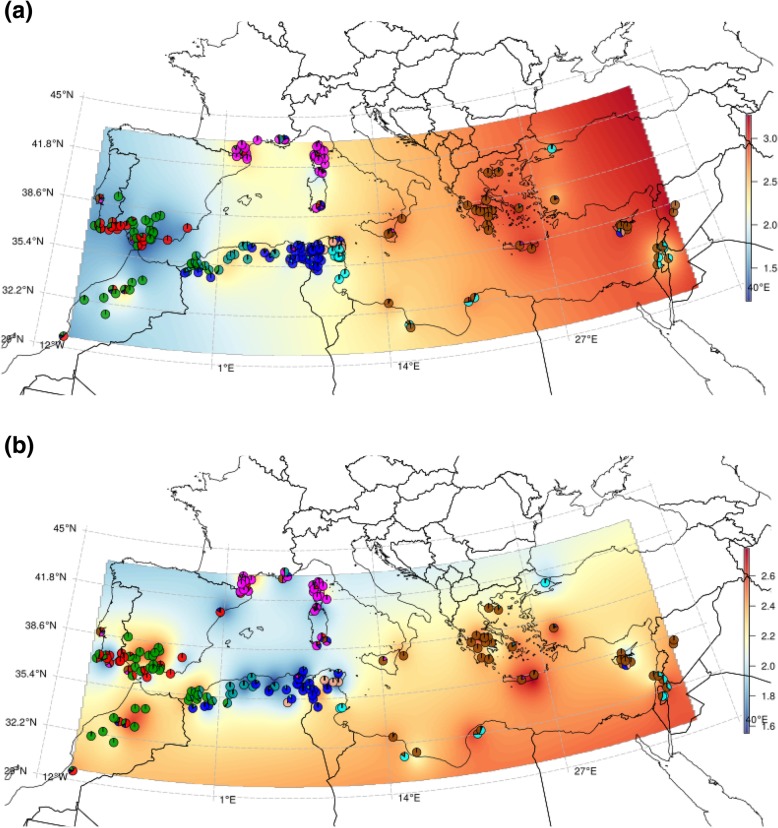
Fig. 5.
Geographical repartition of quantitative disease resistances to soil-borne root pathogens in M. truncatula. a Maximum symptom score (MSS) in response to V. alfalfae, in a collection of 242 accessions. The MSS scale is displayed as a color gradient. The scale of MSS from resistant (blue) to susceptible (red) accessions is indicated on the right. Admixture proportions of each phenotyped accession are summarized by pie charts. b Root rot index following infection of 174 accessions by A. euteiches. The RRI scale is displayed as a color gradient. The scale of the index from resistant (blue) to susceptible (red) accessions is indicated on the right. At each evaluated accession, a pie chart presents the admixture patterns. Raw data from Bonhomme et al. [17]. A Lambert Conic Conformal Projection (EPSG:3034), suitable for the Mediterranean Basin, was used to draw the geographical maps

