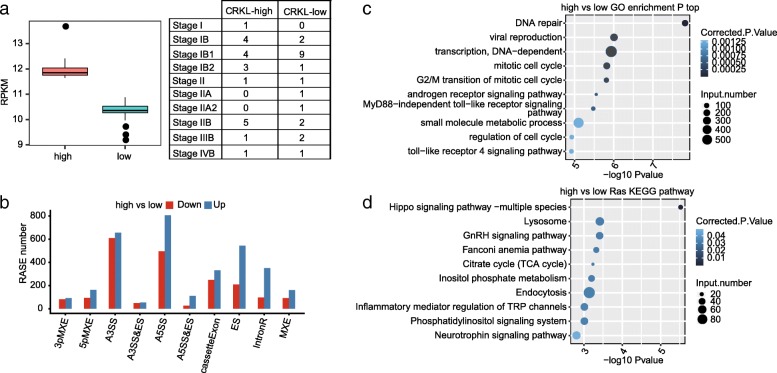
Fig. 2.
Analysis of potential CRKL-regulated alternative splicing events and genes in cervical cancer clinical samples. a Plot of the expression of CRKL in two groups of samples with CRKL being differently expressed. The samples were grouped based on their CRKL expression level regardless of their pathological stages. b Bar plot of the distribution of AS events showing significant difference between the high- and low-CRKL groups of samples. The regulated AS events (RASE) were classified into 10 different types which were detailed in the Methods. The red and blue bars indicate the number of AS events upregulated and downregulated in the high-CRKL groups when compared to the low-CRKL group. c The top 10 GO biological process analysis and (d) KEGG functional pathway in which the alternative splicing genes were enriched

