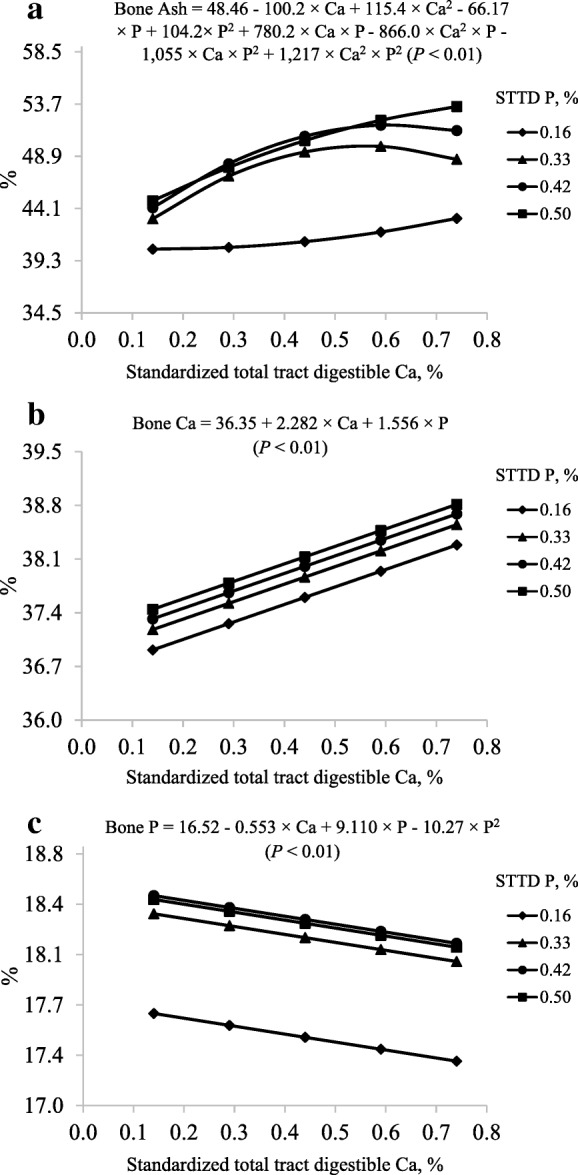
Fig. 3.

Models and predicted values, based on the interactions between Ca and P (P < 0.01), for percentage of (a) bone ash (%), based on the linear effect of Ca (P < 0.01) and P (P < 0.10), for percentage of (b) bone Ca, and based on the linear effect of Ca and P (P < 0.05) and the quadratic effect of P (P < 0.05), for percentage of (c) bone P at d 21 in pigs fed diets containing from 0.14% to 0.74% standardized total tract digestible (STTD) Ca and from 0.16% to 0.50% STTD of P
