Fig. 6.
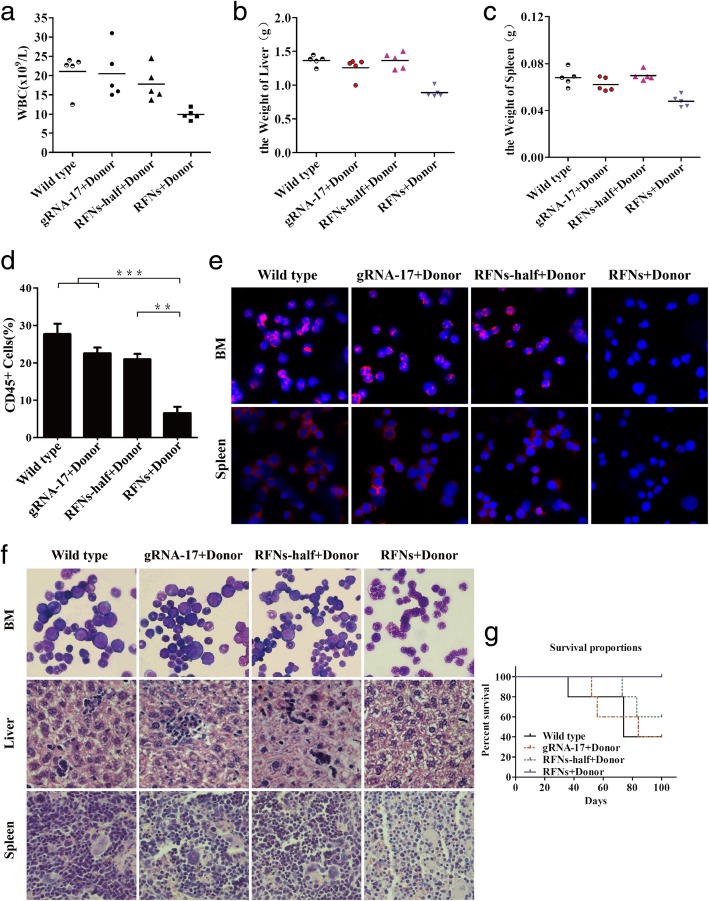
The leukemogenic capacity of bcr-abl in mice was impaired by RFNs. a WBC counts in each group were counted. The maximum value of each mouse was recorded. b, c The weights of spleen and liver of mice in each group were measured. d The amount of human CD45+ cells was tested by flow cytometry. e The expression of BCR-ABL protein in each group was detected by immunofluorescent assay. f Immature cells from bone marrow were checked by Wright’s stain and the infiltration of spleen and liver was analyzed by H&E stain. g Kaplan-Meier method to analyze the survival curves of mice in each group

