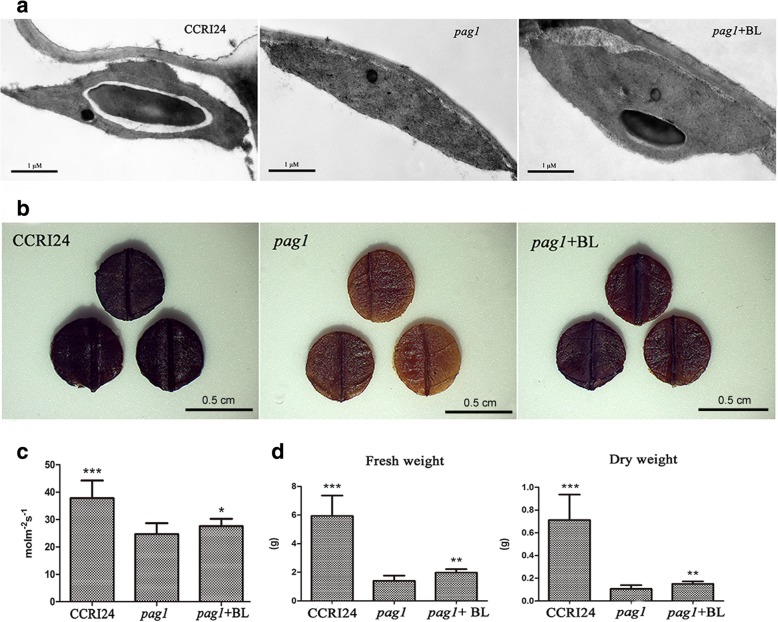
Fig. 5.
Analysis of photosynthetic rates and starch contents in pag1 and CCRI24. a Observations of starch granules in the top fourth leaves of pag1, CCRI24 and 24-epi-BL-treated pag1 plants using transmission electron microscopy. Bar = 1 μm. b Observations of starch contents in the top fourth leaves of pag1, CCRI24 and 24-epi-BL-treated pag1 plants using the iodine staining method. Bar = 0.5 cm. c Photosynthetic rate analysis of pag1, CCRI24 and 24-epi-BL-treated pag1 plants. d Fresh weight and dry weight of pag1, CCRI24 and 24-epi-BL-treated pag1 plants at the three-leaf stage. (t test): *, P < 0.05; **, P < 0.01; ***, P < 0.001

