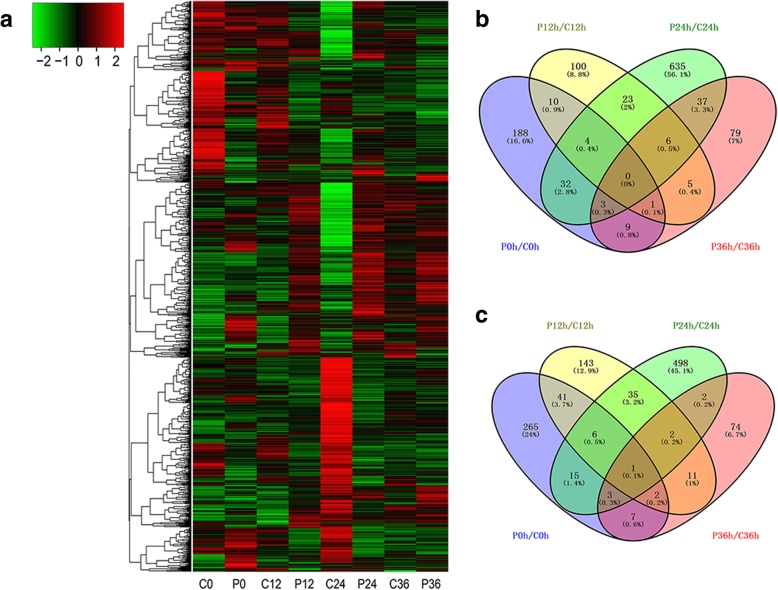
Fig. 6.
Overview of serial analysis of differentially abundant proteins between pag1 and CCRI24 after PEG treatment. a Hierarchical clustering analysis of all differentially abundant proteins based on iTRAQ data. b and c Venn diagrams of up- and down-regulated proteins in comparisons of P0/C0, P12/C12, P24/C24 and P36/C36. P, pag1; C, CCRI24; 0, 12, 24 and 36 represent the trefoil-stage roots of pag1 and CCRI24 after treatment with 6% PEG6000 for 0 h, 12 h, 24 h and 36 h, respectively

