Fig. 3.

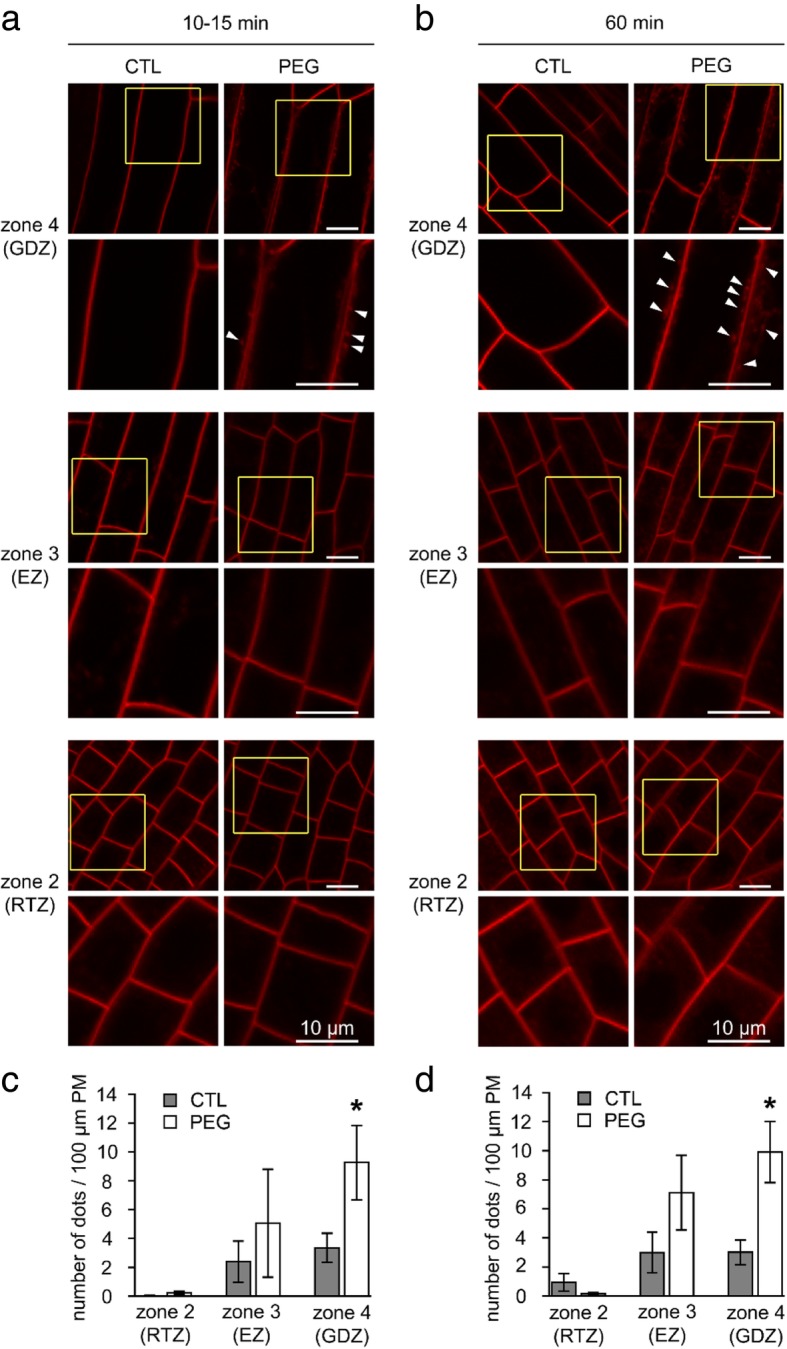
Spatial and temporal stimulation of endocytosis in rhizodermal cells of accession A17 LRs in response to PEG treatment. Representative confocal images of rhizodermal cells of untreated (CTL) or treated roots with 15% PEG (PEG) after (a) 10–15 min or (b) 60 m in the three root zones (see Fig. 2). For each zone a magnification of inset is shown. Arrowheads indicate endocytic fluorescent dots. c, d Quantification of the endocytosis expressed in number of fluorescent dots per 100 μm of PM after 10–15 min (c) or 60 min (d) in control (grey bars) or PEG-treated cells (white bars) according to cell type zone. Values are the means ± SE of 4–6 independent replicates (6–9 roots). Asterisks (*) represent statistical significance of Mann-Whitney test (p < 0.05)
