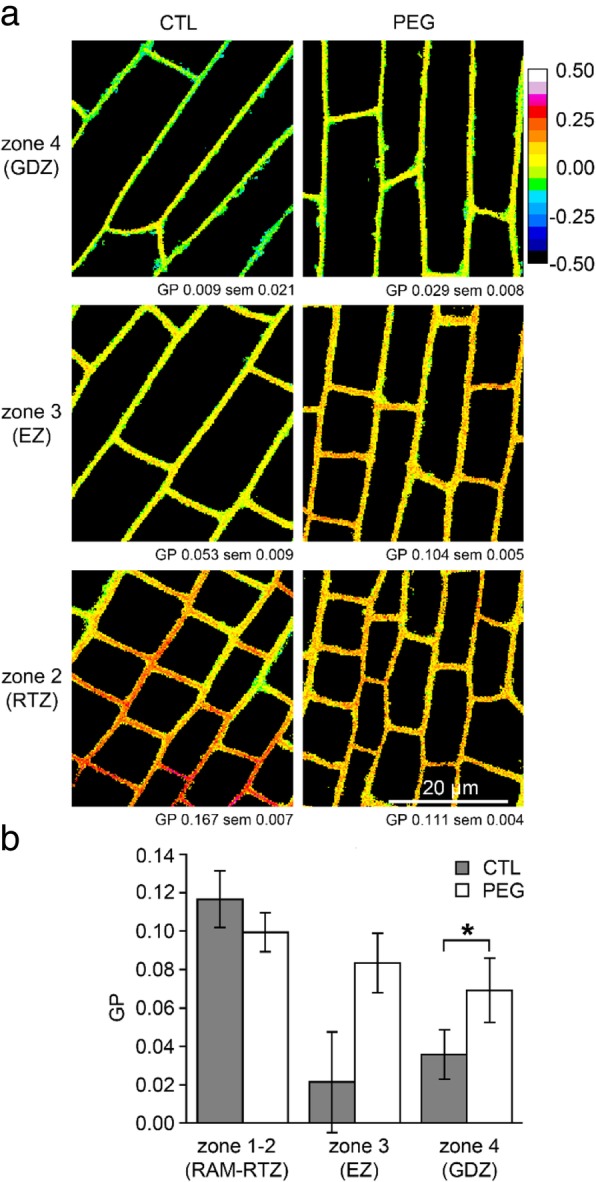
Fig. 6.

Membrane organization of rhizodermal cells along longitudinal pattern is affected by PEG treatment. a Images of rhizodermal cells in three root zone in absence (CTL) or presence (PEG) of 15% PEG. Numbers below images represent the mean of GP value +/− SE in the cells represented in the image. b Quantification of GP values calculated in rhizodermal cells in absence (CTL) or presence (PEG) of 15% PEG. Values are the mean ± SE of cells from 9 roots for CTL and 10 roots for PEG treatment. Asterisk (*) represents statistical significance of Mann-Whitney test (p < 0.05)
