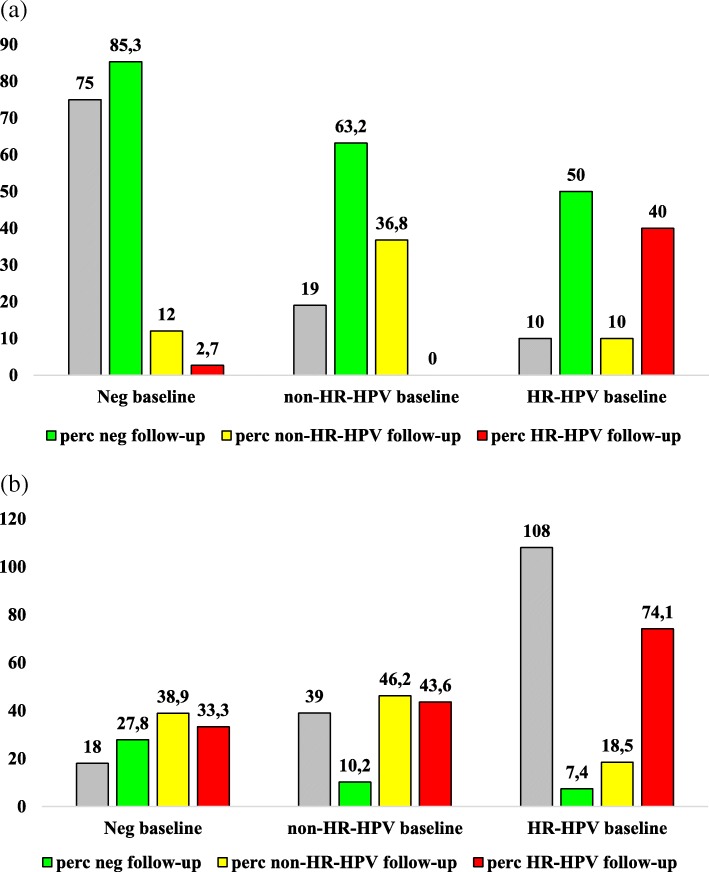
Fig. 3.
Description of modifications at follow-up (24 months after baseline) of HPV patterns detected at baseline. The first column correspond to baseline data (expressed as absolute number). Green, yellow and red columns correspond to the proportion of negative, non-HR-HPV HR-HPV respectively detected at follow-up as evolution of each HPV pattern at baseline. Panel a refers to oral samples and panel b refers to anal samples. HR-HPV: HR HPV genotypes. Non-HR-HPV: only non high risk HPV genotypes

