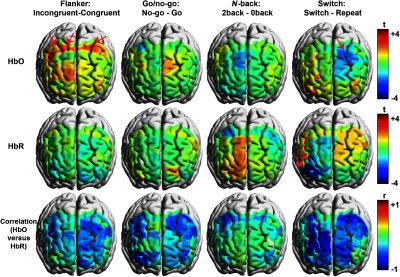
Fig. 3.

Front view of the brain activation and correlation maps for the four EF tasks. Interpolated -values from the contrast between the experimental and the control conditions are rendered on the brain templates in the first two rows. The bright color with positive -values demonstrates that the experimental cases elicit increased HbO/HbR activation, whereas the dark color with negative -values denotes that the control cases elicit enhanced HbO/HbR activation. In addition, the significant channels are indicated by the red arrows. In addition, correlation maps are displayed in the third row, in which the bright color denotes more positive correlation, whereas the dark color denotes more negative correlation.
