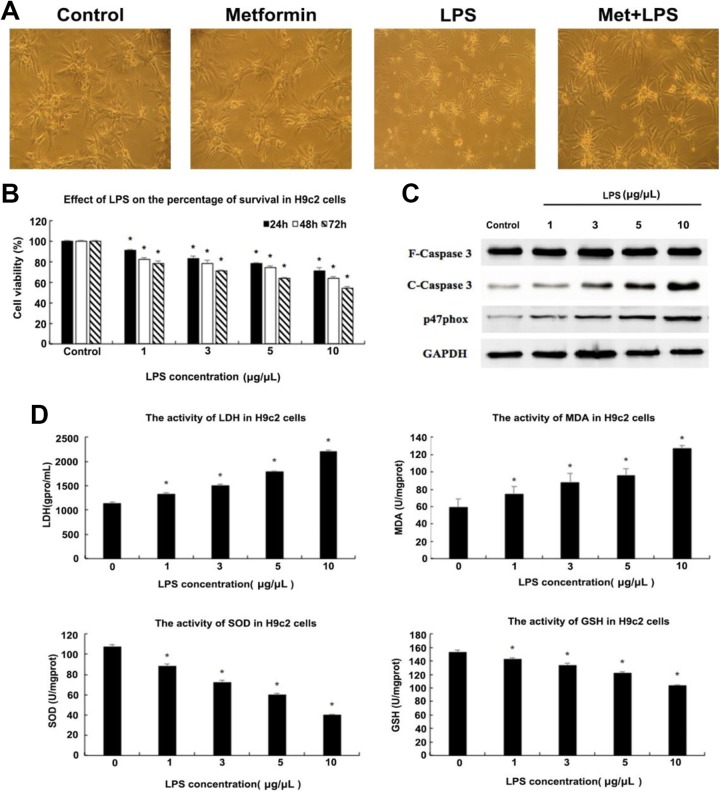
Figure 1.
Effects of lipopolysaccharide (LPS) on H9c2 cells. (A) Microscopic images of H9c2 cells under different treatments. The morphology of H9c2 cells was worse after stimulation with 5 μg/μL LPS compared to control, which was improved after 10 mM metformin administration. Additionally, the cell status under the preadministration of metformin was comparable to that of the control group. (B) Cells’ viability detection of H9c2 using MTT assay after incubation with different concentrations of LPS (0, 1, 3, 5, 10 μg/μL) for 24, 48, 72 hours, respectively. There are significant differences in cells viability administrated with different concentrations of metformin for different times, (C) Western blot was used to detect the expression levels of several proteins in H9c2 cells under different concentrations of LPS stimulation (using glyceraldehyde phosphate dehydrogenase [GAPDH] as internal reference). Expression levels of cleaved Caspase3 and p47phox showed a dose-dependent increase. (D) The activities of lactate dehydrogenase (LDH), malondialdehyde (MDA), superoxide dismutase (SOD), and glutathione (GSH) in H9c2 cells under different concentrations of LPS treatment were evaluated by microplate reader to determine the appropriate dose to construct the model of cardiomyocytes injury. The activities of LDH and MDA showed an LPS dose-dependent increase, while those of SOD and GSH showed the contrary trend. *P < .05 vs control group, n = 3 for each group.

