
Figure 4. Evolutionary relationship of SNP-1245 and Indel-2339 and a polygenic map for the pre-Columbian spread of maize throughout the Americas.
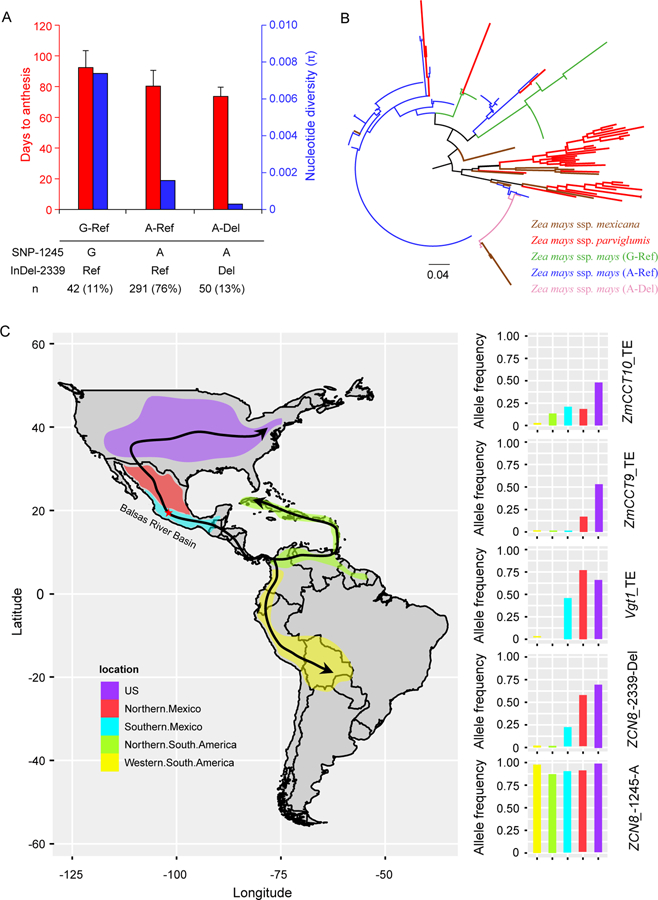
(A) Haplotype analysis of SNP-1245 and Indel-2339 in the maize association panel. According to the genotypes of SNP-1245 and Indel-2339, the maize inbred lines could be divided into three haplotype groups (x-axis) (G-Ref, A-Ref and A-Del). The left y-axis shows the phenotypic value (days to anthesis) of each haplotype (red bars); The right y-axis shows the nucleotide diversity (π) of each haplotype (blue bars). (See also Figure S2; Table S2). (B) Phylogenetic analysis of the promoter region around ZCN8 in maize and teosinte (see also Data S1). Lines belonging to G-Ref, A-Ref and A-Del are indicated in green, blue and pink, respectively. Zea mays parviglumis and Zea mays mexicana are indicated in red and saddlebrown, respectively. (See also Data S1). (C) A polygenic map for the pre-Columbian spread of maize throughout the Americas. Matsuoka et al. (2002)[1] and Vigouroux et al. (2008)[26] developed a scenario for the pre-Columbian spread of maize through the Americas. The red star indicates the central region of the Balsas River Basin, where maize domestication is thought to have occurred[1]. Arrows indicate probable routes of pre-Columbian dispersion. According to the analyses by Matsuoka et al. (2002)[1] and Vigouroux et al. (2008)[26], the 1,008 maize landraces were divided into five major geographic groups, corresponding to the US, northern Mexico, southern Mexico, northern South America and western South America which are indicated by different colours in the map. Races exhibiting post-Columbian movement[1, 26] were excluded in this analysis. The right panel shows the allele frequency of the early-flowering alleles of four genes (Vgt1, ZmCCT9, ZmCCT10 and ZCN8) in the five geographic groups across the Americas. (See also Figure S2, Table S3–S4 and Data S2).