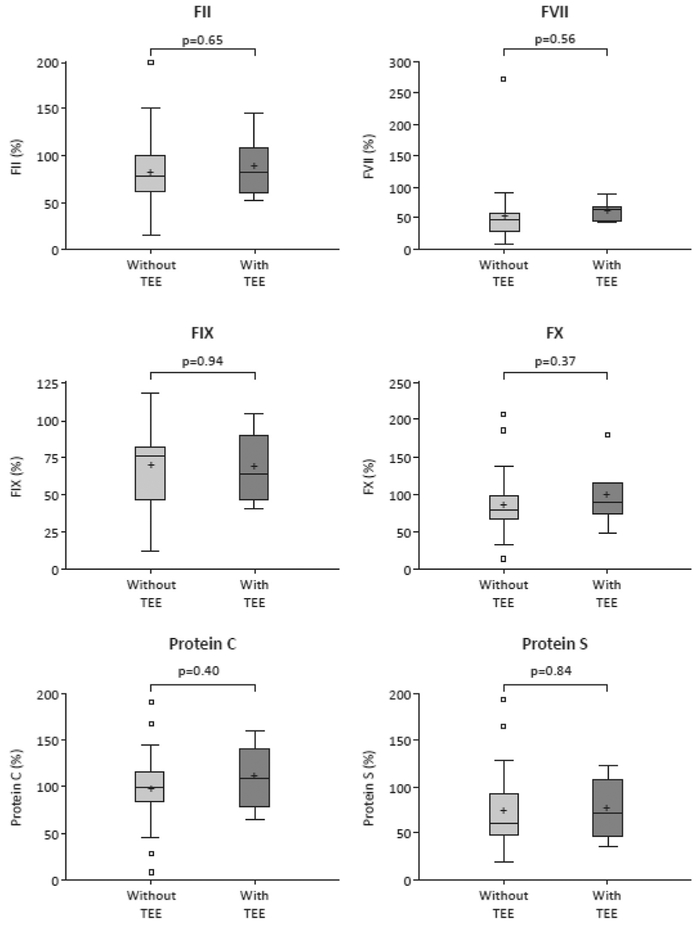
Figure E1.
Median levels of coagulation factors and proteins C and S 0.5 hours after start of 4F-PCC infusion (integrated analysis). F, Factor. + Represents the mean of the data. The line in the middle of the box represents the median. The upper and lower bounds of the box are the 75th and 25th percentiles, respectively. The top of the whisker is the maximum (or 75th percentile+ [1.5×interquartile range] where outliers are present). The bottom of the whisker is the minimum (or 25th percentile–[1.5×interquartile range] where outliers are present).

