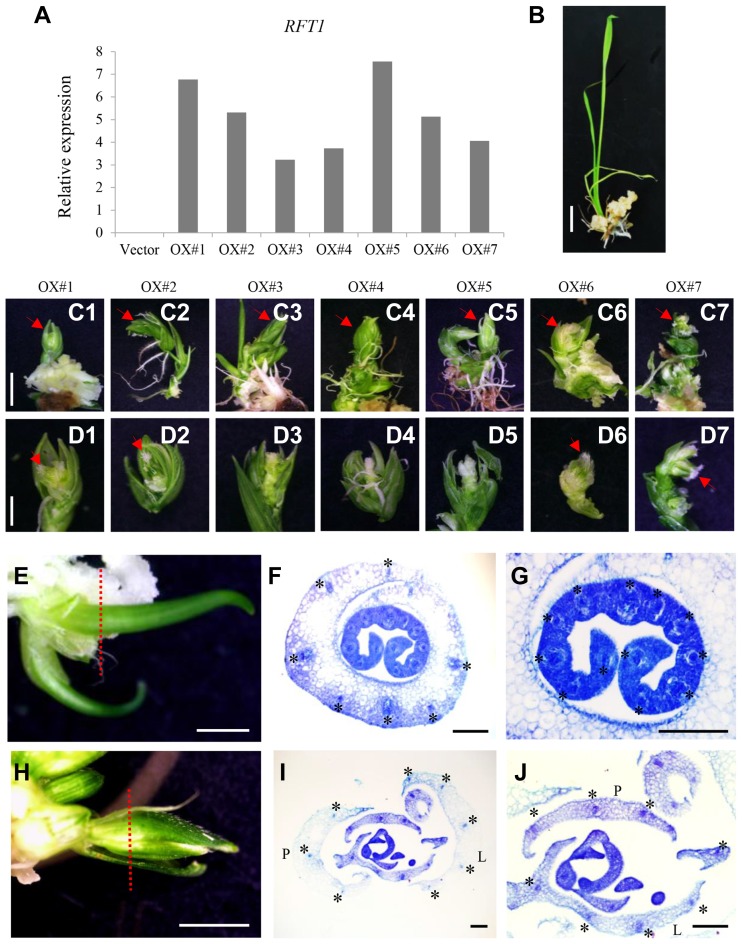
Fig. 2. Phenotypes of RFT1-overexpressing transgenics.
(A) Transcript levels of RFT1 in 7 independent transgenics (#1 through #7) compared with control plant transformed with empty vector. Expression levels are relative to OsUbi1. (B) Regenerating transgenic plant with empty vector. Scale bar = 5 mm. (C) Transgenic plants #1 (C1), #2 (C2), #3 (C3), #4 (C4), #5 (C5), #6 (C6), and #7 (C7). Bars = 5 mm. (D) Close-up of spikelets from #1 (D1), #2 (D2), #3 (D3), #4 (D4), #5 (D5), #6 (D6), and #7 (D7). Bars = 2 mm. (E) Regenerating leaves from control plant transformed with empty vector. Red bar indicates location of cross-cut. (F and G) Cross section of leaves from control plant. Asterisks indicate vascular bundles. (H) Spikelet from RFT1-overexpressing transgenic at Stage 3. Red bar indicates location of cross-cut. (I and J) Cross section of spikelet from RFT1-overexpressing transgenic. Asterisks indicate vascular bundles. L, lemma; P, palea. Scale bars = 2 mm (E, H) or 100 μm (F, G, I, and J).

