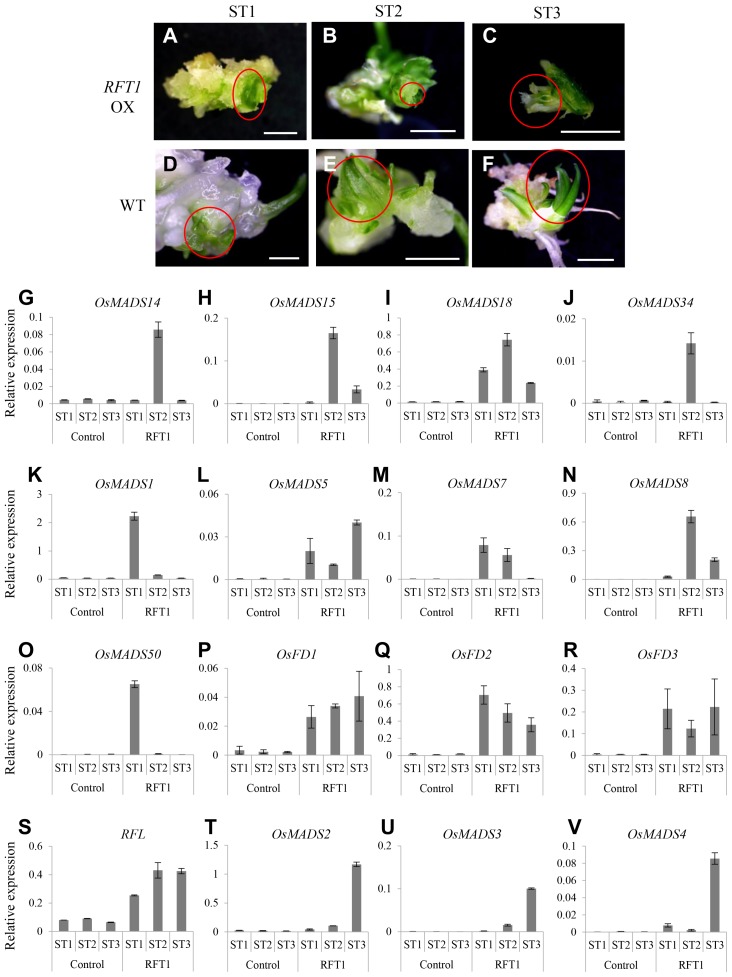
Fig. 3. Expression analyses of regulatory genes during spikelet development in RFT1-overexpressing transgenics compared with WT.
(A) Stage 1. RFT1-overexpressing transgenic callus with greening tissues approximately 1 month after shoot induction. (B) Stage 2. Transgenic callus with multiple leaf-like organs, approximately 6 d after Stage 1. (C) Stage 3. Floret inside spikelet from transgenic, approximately 5 d after Stage 2. (D–F) Control plants transformed with empty vector, visualized at stages equivalent to ST1, ST2, and ST3 of RFT1-expressing transgenics. Scale bar: 2 mm. Transcript levels of OsMADS14 (G), OsMADS15 (H), OsMADS18 (I), OsMADS34 (J), OsMADS1 (K), OsMADS5 (L), OsMADS7 (M), OsMADS8 (N), OsMADS50 (O), OsFD1 (P), OsFD2 (Q), OsFD3 (R), RFL (S), OsMADS2 (T), OsMADS3 (U), and OsMADS4 (V). Expression levels are relative to OsUbi1. Error bars indicate standard deviation for 6 biological replicates.

