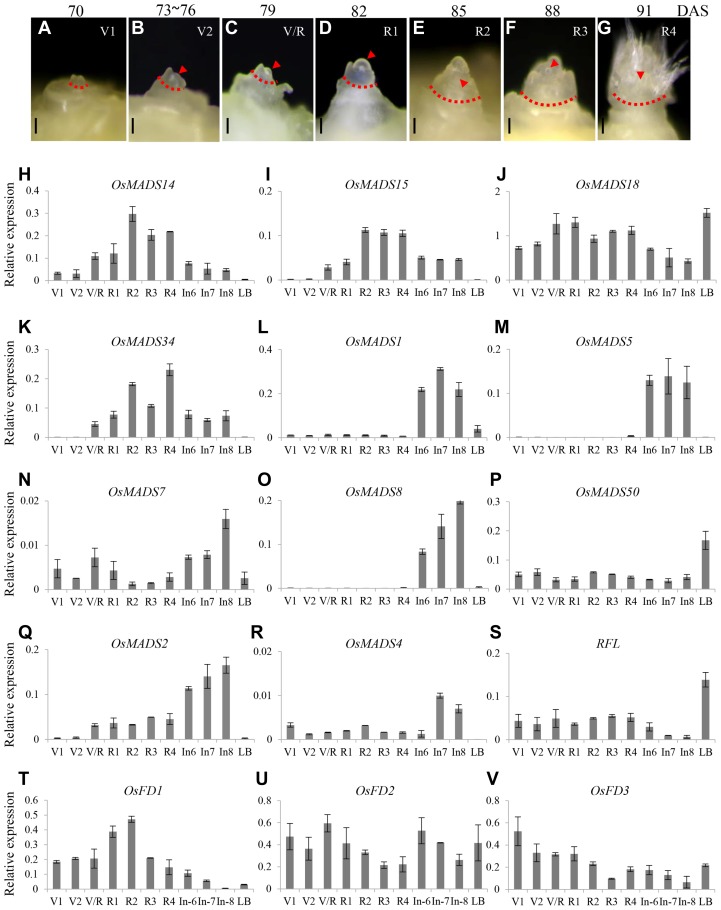
Fig. 6. Expression analyses of regulatory genes in SAM of WT plants.
Shoot apex regions in paddy-grown WT plants, harvested at vegetative stages V1 (A) and V2 (B), transition stage (C), and reproductive stages R1 (D), R2 (E), R3 (F), and R4 (G). Scale bars: 200 μm. Transcript levels of OsMADS14 (H), OsMADS15 (I), OsMADS18 (J), OsMADS34 (K), OsMADS1 (L), OsMADS5 (M), OsMADS7 (N), OsMADS8 (O), OsMADS50 (P), OsMADS2 (Q), OsMADS4 (R), RFL (S), OsFD1 (T), OsFD2 (U), and OsFD3 (V). Expression levels are relative to OsUbi1. Error bars indicate standard deviation for 6 biological replicates.

