Figure 1.
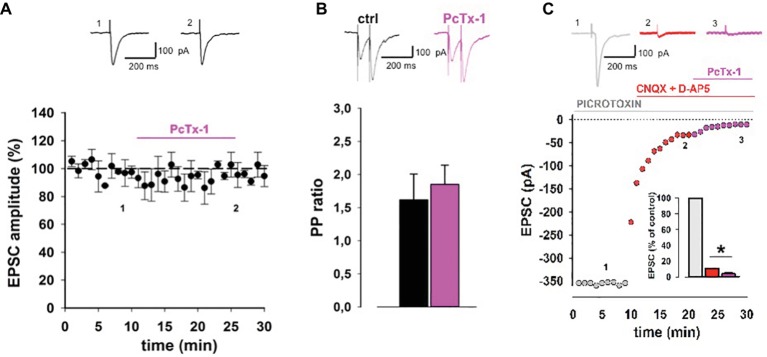
ASIC1a contributes to excitatory synaptic transmission in hippocampal slices. (A) Normalized pooled data showing EPSCs in control condition and during PcTx-1 (100 ng/ml) bath application (mean ± SEM, n = 12, p > 0.05). EPSC was elicited by monopolar electrode placed on Schaffer collateral fibers. On top, representative EPSC traces were taken at the time indicated by number. (B) Bar chart illustrates normalized PPR (50 ms inter-pulse interval) in control condition and during PcTx-1 (100 ng/ml) bath application (mean ± SEM, n = 8, p > 0.05). On top, representative EPSC traces are shown. (C) Slices were perfused with picrotoxin (GABAA receptor antagonist, grey), plus CNQX (30 μM; AMPA receptor antagonist) and D-AP5 (50 μM; NMDA receptors antagonist, red), and subsequently with 100 ng/ml PcTx-1 (pink). Panel shows one representative experiment, bar chart in the inset illustrates the amplitude of EPSC (% of control) in the different conditions (mean ± SEM, n = 6, *p < 0.05).

