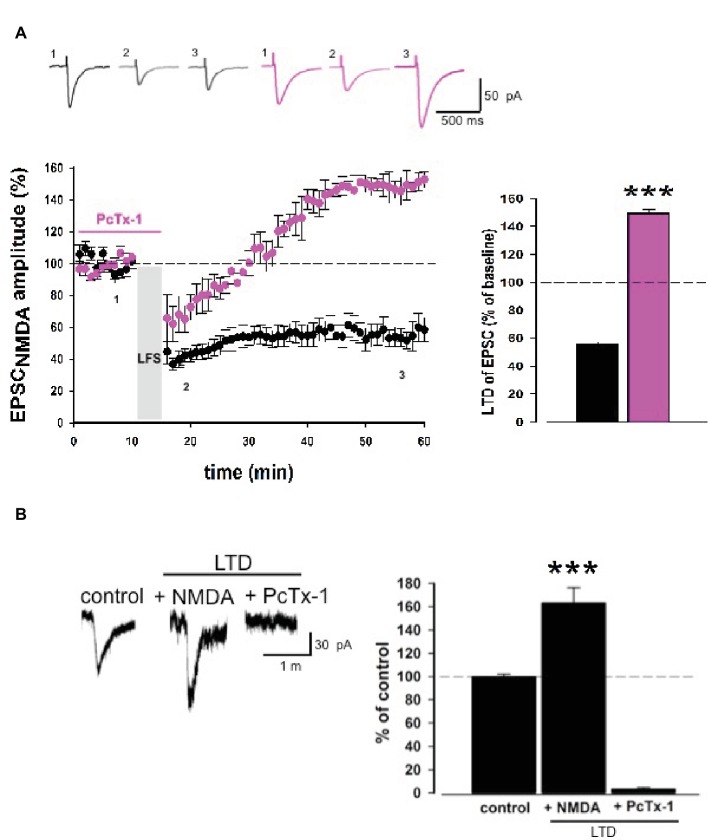
Figure 5.
PcTx-1 converts LTD of EPSCNMDA to LTP. (A) Normalized pooled data showing LTD of EPSCNMDA in control condition (black) and in the presence of PcTx-1 before and during LFS (100 ng/ml, pink). Histogram represents the last 5 min of experiment in control condition (n = 9) or in the presence of PcTx-1 (n = 7) (mean ± SEM, ***p < 0.001). On top, representative traces are shown for each condition. (B) Histogram represents the amplitude of ASIC1a-mediated inward current (control condition), in the presence of NMDA up to 10 min later, and in the presence of PcTx-1 (n = 6, mean ± SEM, ***p < 0.001). On the left, representative traces are shown for each condition.

