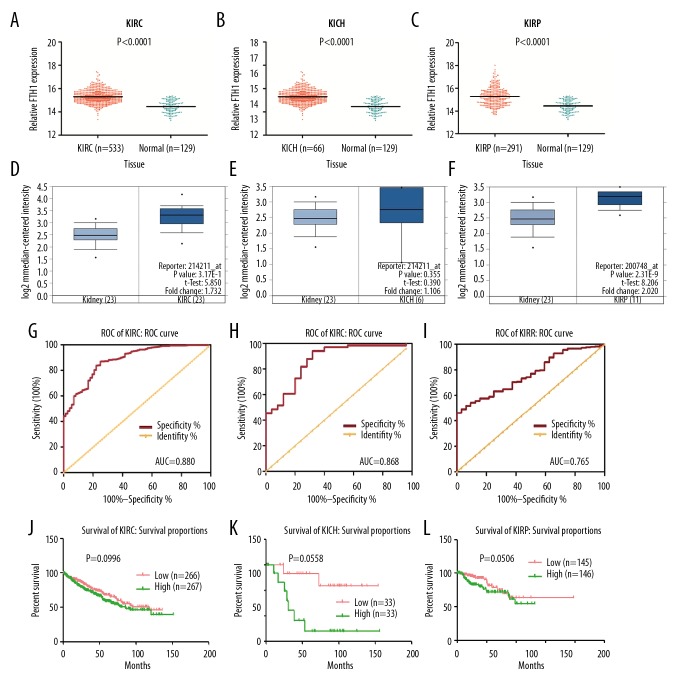
Figure 2.
The transcriptional level of FTH1 gene is higher in KIRC, KICH, and KIRP in contrast with normal kidney tissues. Higher expression of FTH1 was associated with poorer prognosis of KIRC patients. (A–C) Scatter plot of FTH1 gene expression in normal tissues in contrast with 3 subtypes of RCC. (D–F) Validation of FTH1 expression in Jone’s study using ONOCMINE database. (G–I) ROC curve of FTH1 for patients with KIRC, KICH, and KIRP. The AUC was 0.88 (95% CI: 0.841–0.919, p<0.001), 0.868 (95% CI: 0.786–0.950, p<0.001), and 0.765 (95% CI: 0.697–0.834, p<0.001). (J–L) The overall survival (OS) of patients with KIRC, KICH, and KIRP.

