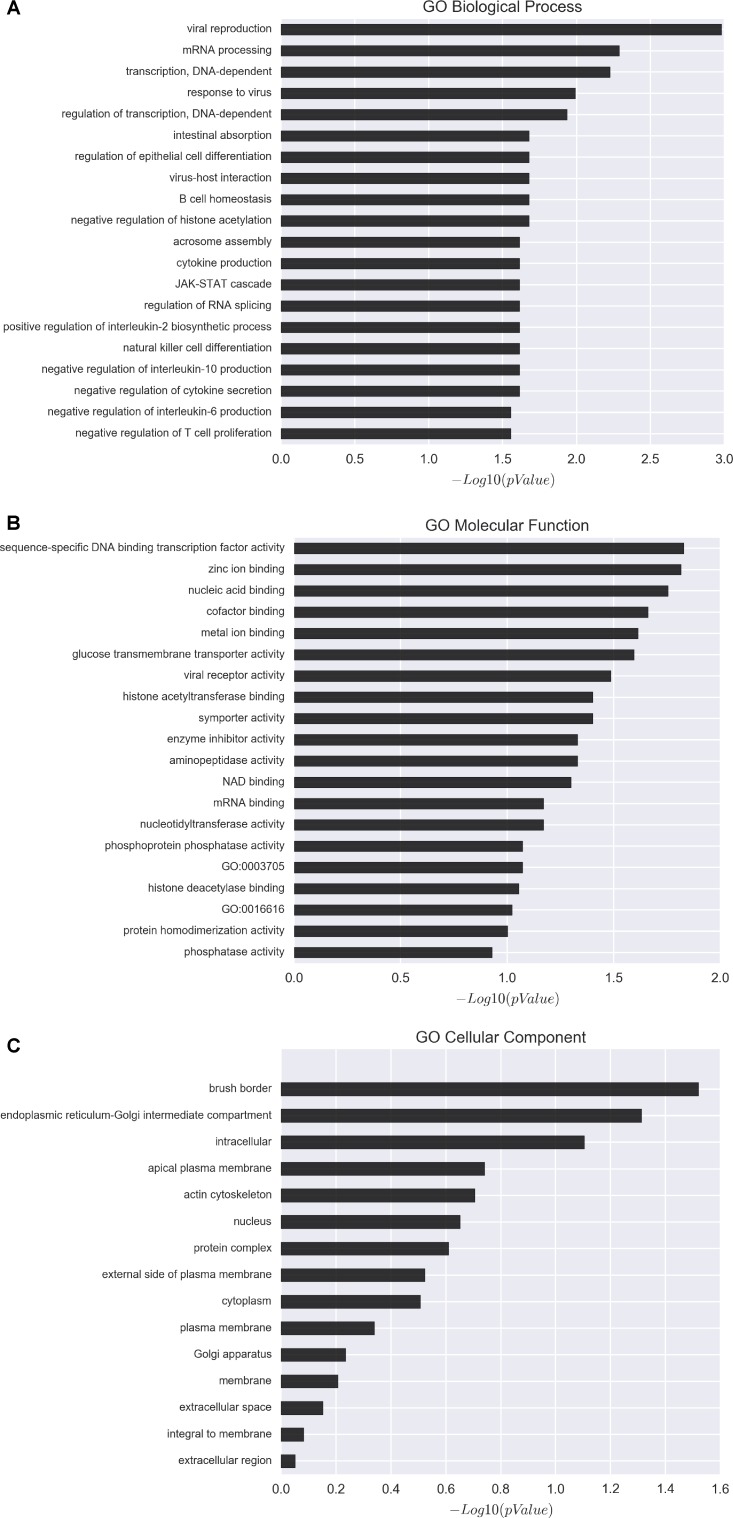
FIGURE 6.
Gene ontology (GO) analysis of affected genes upon perturbation of CRNG functions via siRNAs. (A) GO biological process distribution of differentially expressed genes. (B) GO molecular function distribution of differentially expressed genes. (C) GO cellular component distribution of differentially expressed genes. GO-based enrichment analysis showed that the differentially expressed genes mainly enriched in immune and inflammation related pathway.

