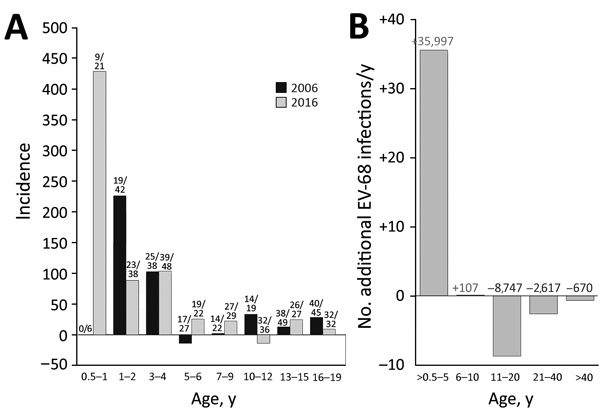
Figure 2.

Comparison of incidence of enterovirus D68 (EV-D68) in the United Kingdom in 2006 and 2016. A) Estimated annual incidence of EV-D68 infection for each age group. Incidence was inferred from the difference in seroprevalence from that of the previous age band and converted into infections/year/1,000 population (by dividing the difference in prevalence by the number of years in the age band and multiplying by 1,000). Frequencies of samples with neutralizing antibody titer >16 are shown above bars. B) Change in incidence of EV-D68 infections from 2006 to 2016, expressed as additional EV-68 infections/year (y-axis scale). Figures above bars indicate the predicted positive (red) and negative (blue) change in number infections if these incidences were applied to the whole UK population, based on age-stratified population totals for 2016 obtained from Statista (https://www.statista.com/statistics/281174/uk-population-by-age).
