
Figure 1.
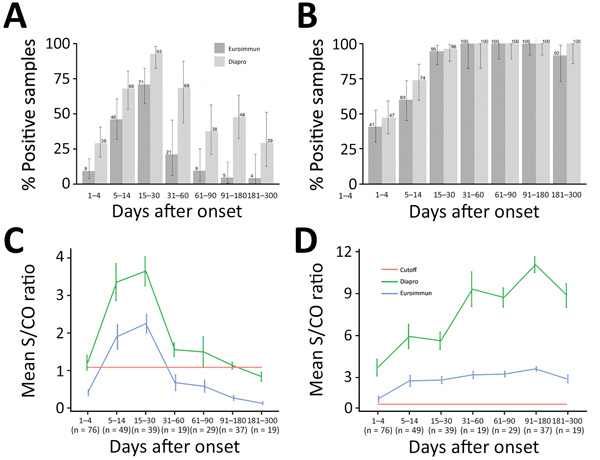
Kinetics of Zika virus IgM and IgG as determined with Euroimmun and Dia.Pro kits for patient samples collected in the first 10 months after infection, by time interval. A, B) Percent positive for Zika virus IgM (A) and IgG (B). Values are given with binomial proportion CI). C, D) Overall time course of mean signal-to-cutoff ratios of Zika virus IgM (C) and IgG (D). Values are shown with SEs. The number of patients sampled is provided for each time interval.