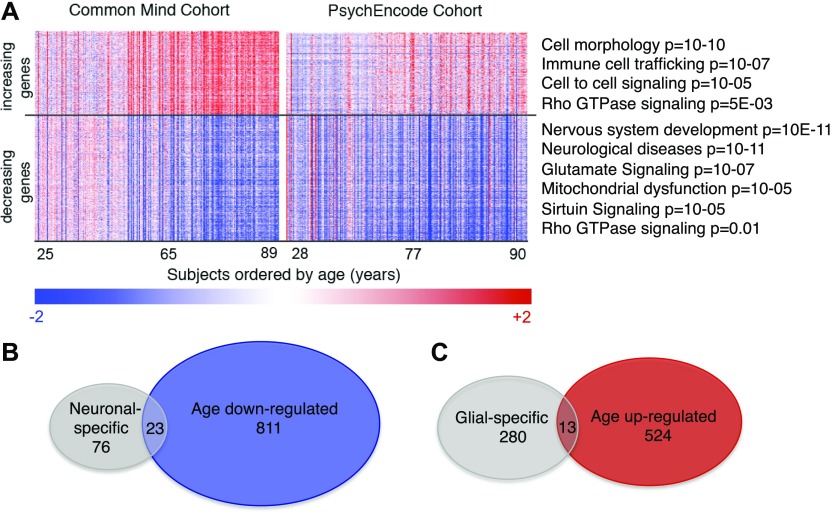
Figure 4. Characterization of age-sensitive transcripts and molecular ages.
(A, B) The 537 increasing and 834 decreasing age-sensitive transcripts are visualized in the heat map (A). Top Ingenuity functional categories are shown for increasing or decreasing transcripts (A). (B, C) Venn diagrams show the intersection of age down-regulated transcripts and neuronal-specific transcripts (B) and age up-regulated transcripts and glial-specific transcripts (C).

