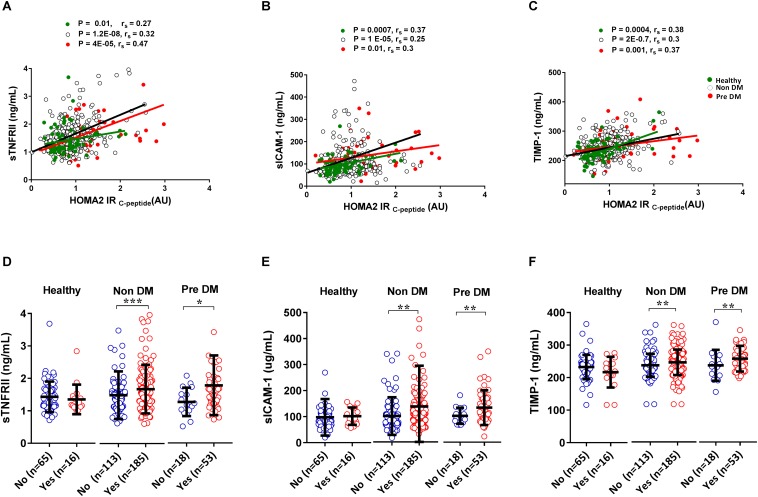
FIGURE 4.
Correlation and association of inflammatory markers with insulin resistance and metabolic syndrome. Inflammatory molecules correlate with an increase in the level of insulin resistance. The green dot indicates Healthy, black circles indicate Non-DM and red dots indicate Pre DM individuals, r indicates Spearman’s rho (A–C). Individuals having metabolic syndrome have a higher level of inflammatory biomarkers (D–F). P-values were calculated using non-parametric Mann–Whitney U-test for comparing between two groups and spearman correlation test was used to correlate inflammatory molecule with insulin resistance (ns P > 0.05, *P <0.05, **P < 0.01, ***P < 0.001).

