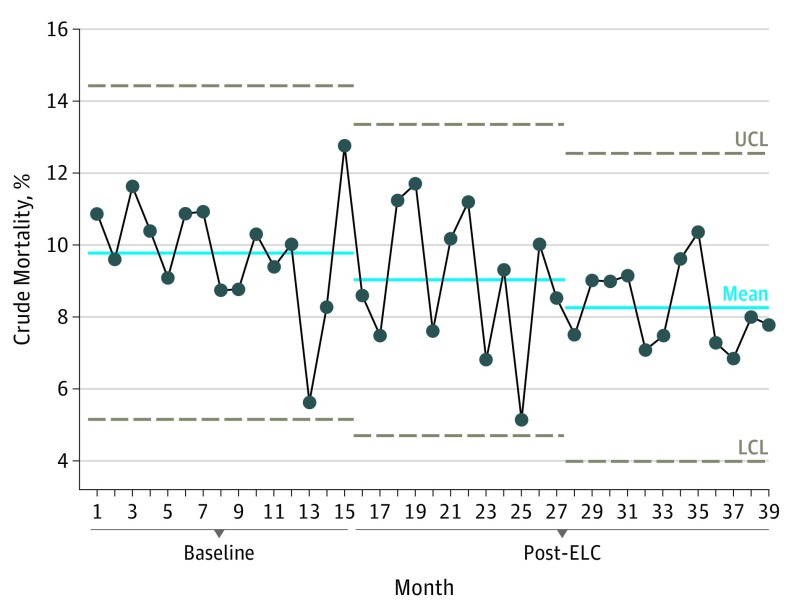
Figure 1. Change in Crude Mortality.
This statistical process control chart shows the stepwise reductions in 30-day unadjusted crude mortality. Months 1 to 15 depict the baseline data (ie, no intervention or care bundle from the Emergency Laparotomy Collaborative [ELC]); post-ELC months 16 to 27, year 1 change; and post-ELC months 28 to 39, year 2 change. LCL indicates lower control limit; UCL, upper control limit.

