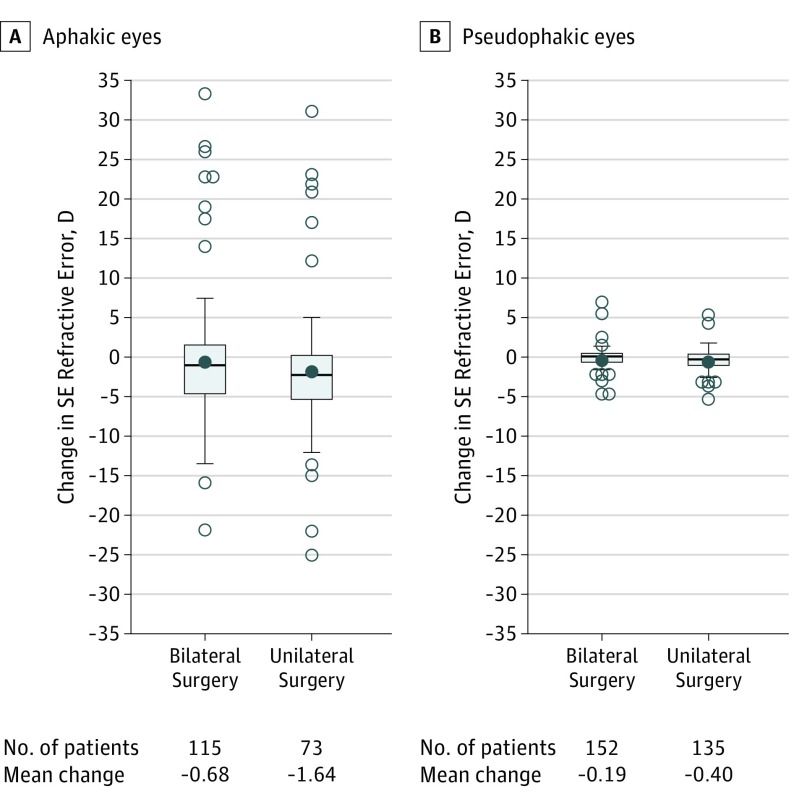
Figure 2. Change in Refractive Error From First Postoperative Visit to 1 Year After Lensectomy Stratified by Laterality of Surgery and Intraocular Lens Implantation.
Negative values indicate a myopic shift. Little change was seen in bilateral pseudophakic eyes (−0.19 diopters [D]) and unilateral pseudophakic eyes (−0.40 D), while modest loss of hyperopia was seen in bilateral aphakic eyes (−0.68 D) and unilateral aphakic eyes (−1.64 D). The top of each box represents the 75th percentile of the data and the bottom of each box represents the 25th percentile of the data. Group medians are represented by the horizontal line in each box and group means by filled circles. The bars extending above and below each box represent 1.5 times the interquartile range (difference between the 75th and 25th percentiles), or the maximum (or minimum) observed value within the range if not as extreme as the calculated value. Open circles represent statistical outliers. SE indicates spherical equivalent.

