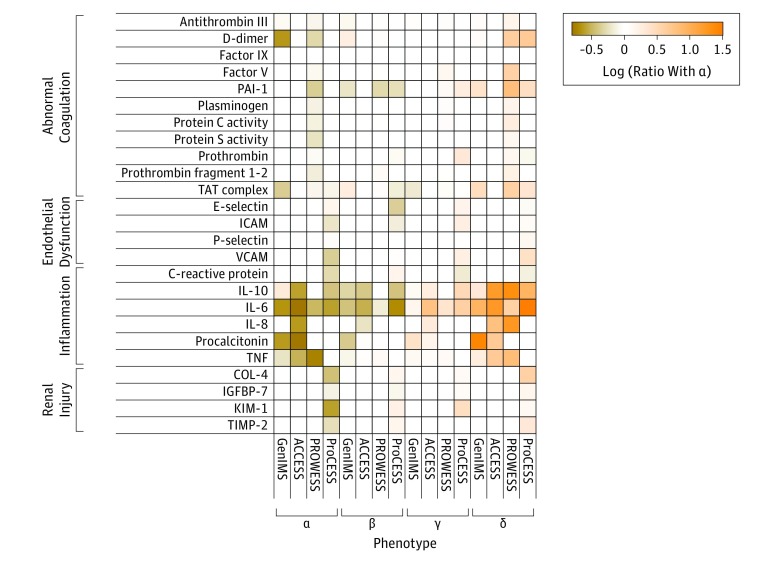
Figure 4. Ratio of Additional Biomarkers in Heatmap.
Heatmap shows the ratio of the median biomarker value for various markers of the sepsis host response grouped by those reflecting coagulation, endothelium, inflammation, and renal injury. Orange represents a greater median biomarker value for that phenotype compared with the median for the entire study, whereas colors in the tan to brown range represent lower median biomarker values compared with the median for the entire study. Empty cells are those for which the biomarker was not measured. The factor V, factor IX, plasminogen, protein C, and protein S biomarkers were reversed on the scale to coordinate the color map. The IL-1b and IL-12 biomarkers are not shown due to having less than 0.5-fold changes. ACCESS indicates A Controlled Comparison of Eritoran in Severe Sepsis; COL-4, collagen type 4; GenIMS, Genetic and Inflammatory Markers of Sepsis; ICAM, intercellular adhesion molecule 1; IGFBP-7, insulin-like growth factor–binding protein 7; KIM-1, kidney injury molecule 1; PAI-1, plasminogen activator inhibitor 1; ProCESS, Protocol-Based Care for Early Septic Shock; PROWESS, Activated Protein C Worldwide Evaluation in Severe Sepsis; TAT, thrombin-antithrombin; TIMP-2, tissue inhibitor of metalloproteinase 2; TNF, tumor necrosis factor; VCAM, vascular cell adhesion molecule.

