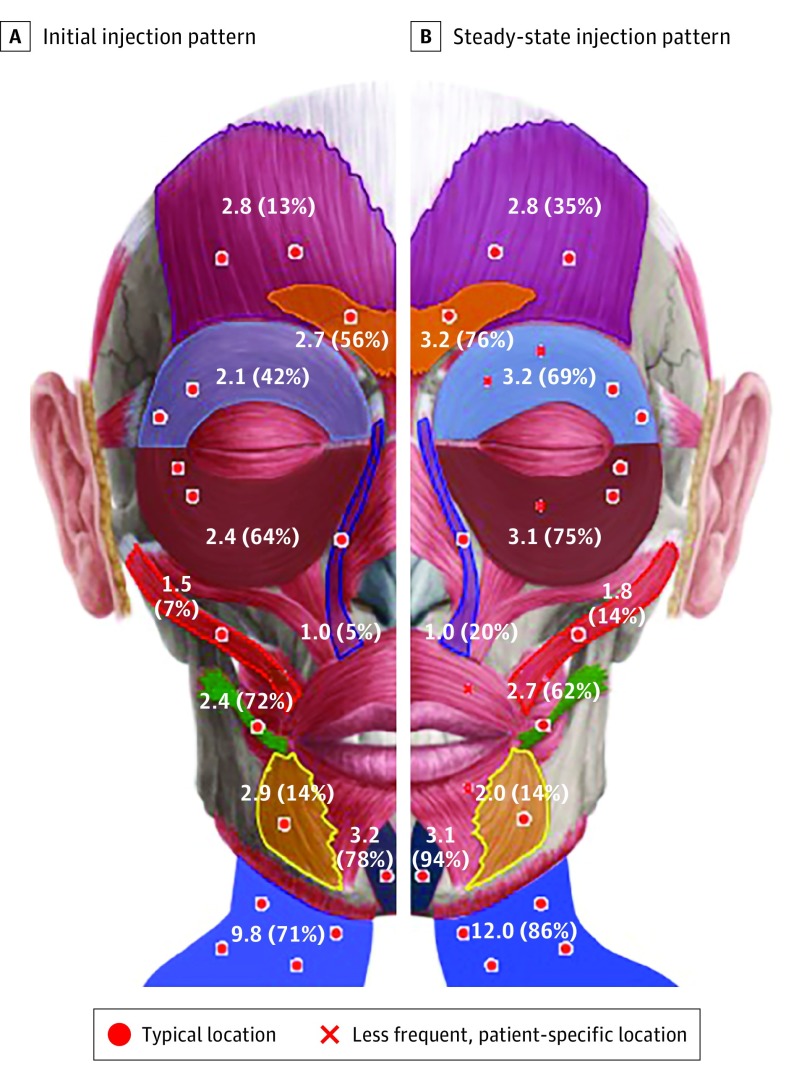
Figure. Initial and Steady-State Treatment Patterns.
Color transparency reflects the frequency a muscle is injected in each new patient (A) and after the botulinum toxin dose is titrated (B). The mean dose in units of botulinum is shown, along with the frequency a muscle is injected (shown in parentheses).

