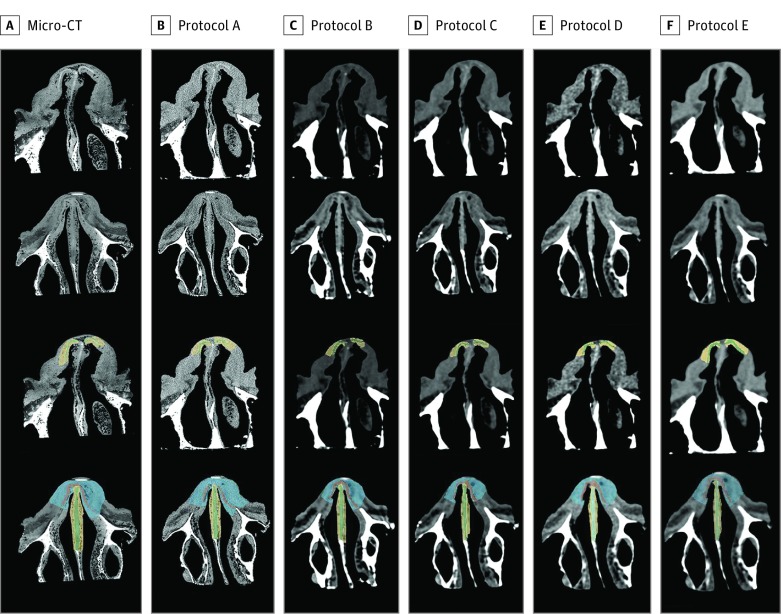
Figure 2. Library Data Set of Micro-CT and Clinical Images.
The micro–computed tomography (CT) and clinical protocols are seen on axial section in columns A through F (images arranged from highest to lowest radiation dose). The first 2 rows show nasal cartilage visualization on the micro-CT. The third and fourth rows show the corresponding nasal cartilage visualization after manual segmentation.

