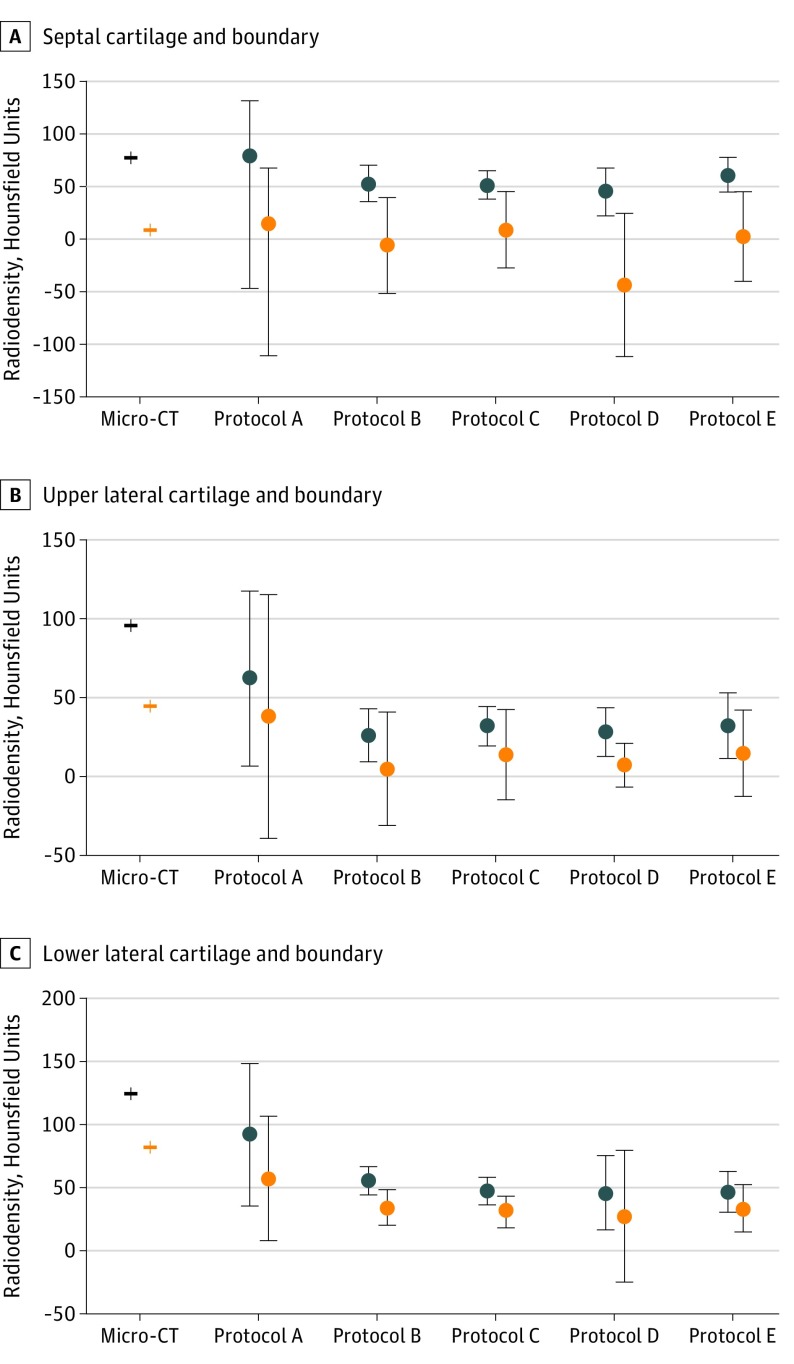
Figure 3. Region of Interest Analysis for Cartilage vs Boundary Across Micro-CT and Clinical CT Protocols.
The mean (SD) of cartilage substructures and boundary was calculated in 3D Slicer for septal cartilage (A), upper lateral cartilage (B), and lower lateral cartilage (C) across the micro-computed tomography (CT) and clinical CT protocols (arranged from highest to lowest radiation dose). Less overlap in density variance between the cartilage and boundary indicates better discrimination of cartilage from boundary.

