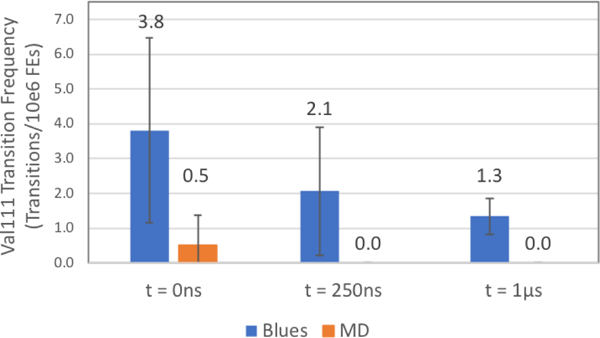
Figure 13: Val111 χ1 state transitions per 106 FEs from simulations from 3 distinct starting conformations of p-xylene bound T4 lysozyme L99A.

The rotamer transition rate for the 3 BLUES and 3 MD simulations are plotted in blue and orange, respectively and are in units of transitions per million FEs. As shown in Supplementary Figures (SI) 2d and 2f, there are 0 recorded transitions for MD simulations starting from the 250ns frame as well as the 1 μs frame. Error bars for transition rates were generated by splitting the simulation data into 3 chunks and computing the standard deviation across chunks.
