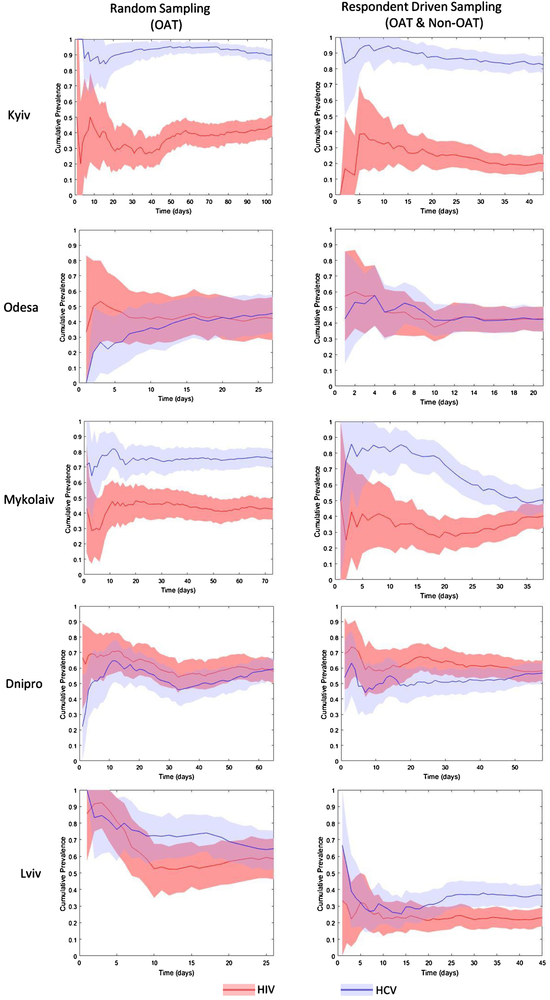
Figure 1: HIV and HCV Cumulative Prevalence by City and Sampling Method (N=1,613).
Note: Shaded regions represents 95% Confidence Interval estimated by nonparametric bootstrap. The cumulative prevalence is based on unweighted sample proportion of HIV and HCV positive individuals calculated over time leading up to each time point.

