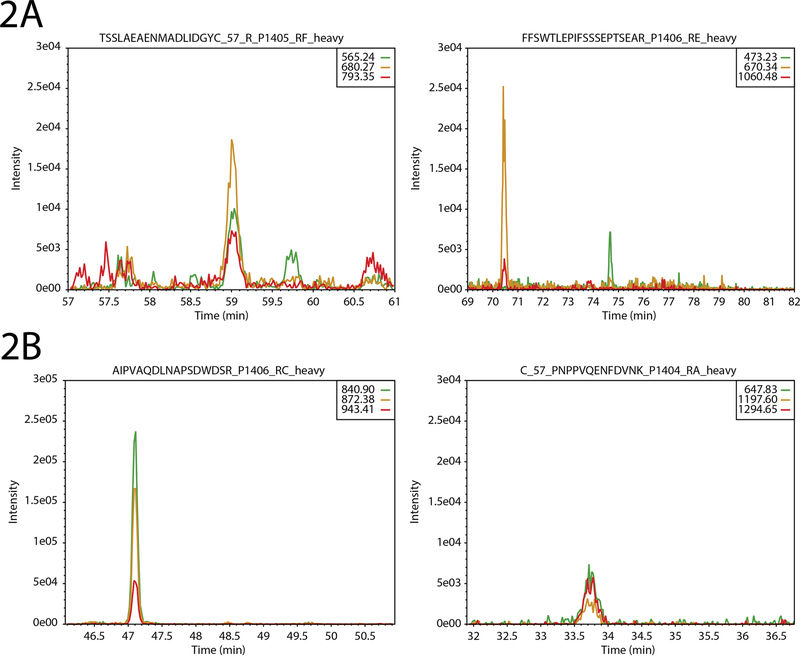
Figure 2.
Multitransition metrics. (A) Transitions that belong to the same peptide should have identical elution profiles. On the left is shown a set of transitions that all elute at the same time; on the right, we see that the peak of the yellow and red transition peaks (~70 min) are distant from the green transition peak (~74 min). (B). Transitions should have sufficient intensity as a group. On the left is a strong and intense set of transitions (note the y-axis scale); on the right is a set of low-intensity transitions. Depending on the user-defined threshold for the total intensity metric, this set of transitions may yield a warning.

