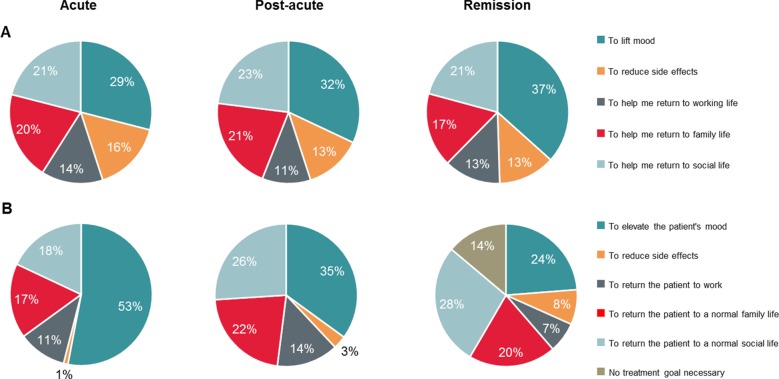
Figure 4.
(A) Treatment goals for patient cohort in each phase. (B) HCP-assessed cohort’s treatment goals. Percentage data refer to the proportion of patients. Q20 (Patient) Which ONE of the following best reflects your hopes for treatment during this phase of depression? Baseline: patients, acute n = 425; post-acute, n = 793; remission, n = 790. Q24/55/86 (HCP) Which ONE of the following best reflects your primary treatment goal during this phase of depression? Baseline: All HCP patient case records. Acute, n = 1,046; post-acute, n = 1,046; remission, n = 1,046. Because of rounding, percentages may not add up to 100%. HCP, health care professional; n, subset of population.

