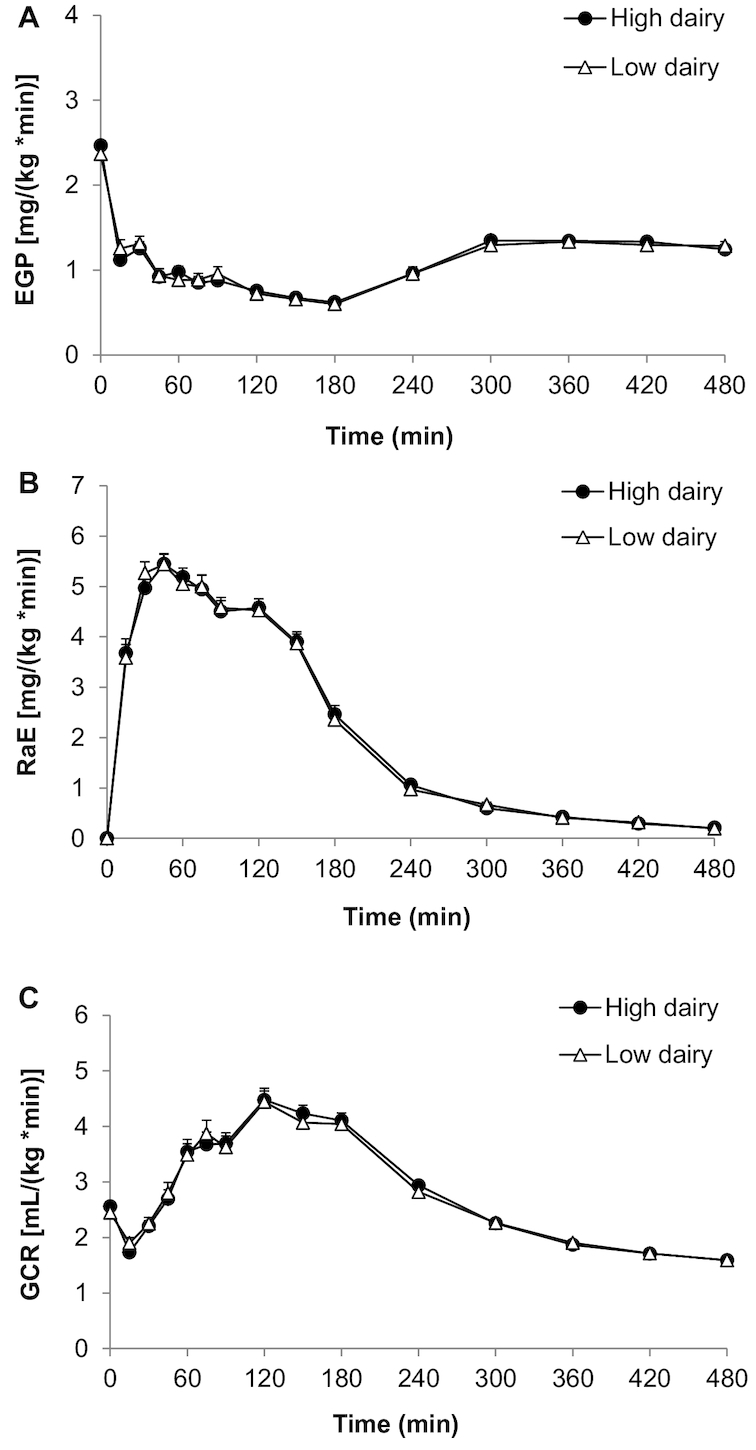
FIGURE 4.

Mean ± SEM EGP (A), RaE (B), and GCR (C) after a 13C-enriched oral-glucose-tolerance test in overweight men and women (n = 43) after a 6-wk high-dairy diet (●) or low-dairy diet (Δ) in a crossover design. Summary measures are presented in Table 5; differences were assessed using linear mixed models. EGP, endogenous glucose production; GCR, glucose clearance rate; RaE, rate of appearance of exogenous glucose.
