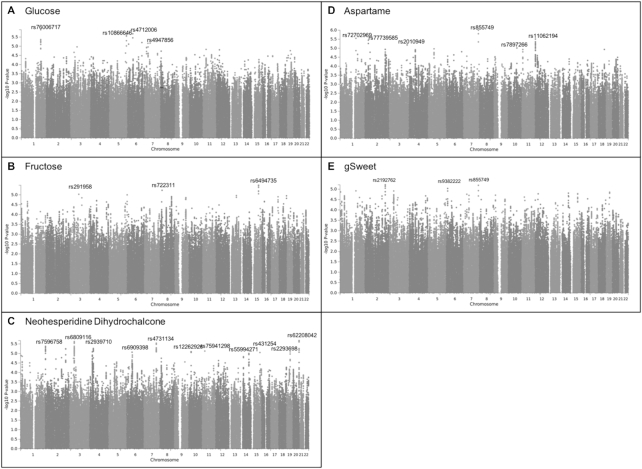
FIGURE 2.
Manhattan plots displaying the association -log10P value for each SNP in the genome and the perceived intensity of glucose (A), fructose (B), NHDC (C), aspartame (D), and gSweet (E) in 1757 Australian adolescent twins and their siblings. Only the top SNP with P < 1.0 × 10⁻⁵ for each chromosome is labeled. gSweet, general sweet factor (a weighted mean of ratings of glucose, fructose, NHDC, and aspartame); NHDC, neohesperidin dihydrochalcone; SNP, single nucleotide polymorphism.

