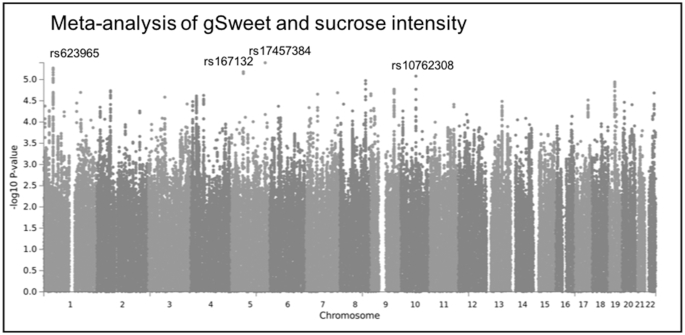
FIGURE 4.
Manhattan plot for the meta-analysis of the perceived intensity of gSweet (Figure 2E) and sucrose (Figure 3A). The top single nucleotide polymorphism with P < 1.0 × 10⁻⁵ for each chromosome is labeled. gSweet, general sweet factor (a weighted mean of ratings of glucose, fructose, neohesperidin dihydrochalcone, and aspartame).

