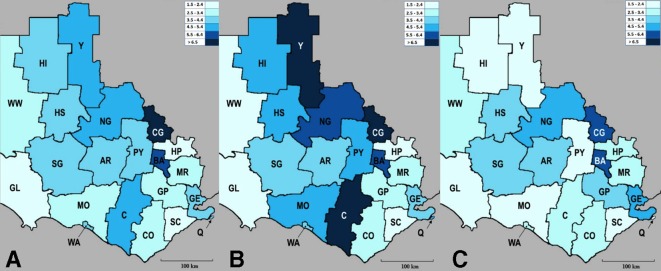
Figure 2.
Density map showing T1DM-hospitalisation rate for (A) men and women combined (B) men only and (C) women only for the ACDI study region during 2011–2014 inclusive (age-standardised rates per 1000 population per year). LGAs are shaded according to the legend from the lowest to highest hospitalisation rates. ACDI, Ageing, Chronic Disease and Injury; AR, Ararat; BA, Ballarat; C, Corangamite; CG, Central Goldfields; CO, Colac Otway; GE, Greater Geelong; GL, Glenelg; GP, Golden Plains; HI, Hindmarsh; HP, Hepburn; HS, Horsham; LGAs, local government areas; MO, Moyne; MR, Moorabool; NG, Northern Grampians; PY, Pyrenees; Q, Queenscliffe; SC, Surf Coast; SG, Southern Grampians; T1DM, type 1 diabetes mellitus; WA, Warrnambool; WW, West Wimmera; Y, Yarriambiack.

